
Circleator - Command Line Usage
Overview
This page covers the ins and outs of running Circleator on the command line. A web-based interface (“Ringmaster”) to Circleator is also under development and a prototype has been created but not yet released. The following topics are covered here:
- Quick Start Guide - how to run Circleator on the command line
- Command Line Options - customizing Circleator’s output with command line options
- Configuration File - writing/customizing the Circleator configuration file
- Input Data - various options for specifying the input sequence(s) and annotation
Quick Start Guide
Assuming that a copy of Circleator has been installed as described in the Installation Guide, you will need at least the following two things in order to run the program successfully:
- Sequence and/or sequence annotation in a BioPerl-supported format (e.g., a GenBank flat file.)
- A Circleator configuration file that specifies how to plot this information.
We’ll start by using a GenBank flat file and a Circleator configuration file that are both included in the downloadable Circleator zip/tar file:
data/CM000961.gbk, the GenBank WGS flat file for Corynebacterium genitalium ATCC 33030conf/genes-percentGC-GCskew-1.cfg, a predefined configuration file which plots annotated genes and a couple of graphs
Step 1: Run Circleator to create a figure in SVG format
Assuming that the main circleator program has been installed into
/usr/local/bin, the following command (when run from the top level
of the unpacked Circleator zip/tar file) will invoke Circleator using
the two files mentioned above. Since Circleator produces output in
SVG format we will direct the output to a file called “fig1.svg”:
/usr/local/bin/circleator --data=./data/CM000961.gbk --config=./conf/genes-percentGC-GCskew-1.cfg >fig1.svg
The output from a successful run should look something like this:
INFO - started drawing figure using ./conf/genes-percentGC-GCskew-1.cfg
INFO - reading from annot_file=./data/CM000961.gbk, seq_file=, with seqlen=
INFO - CM000961: 4590 feature(s) and 2349953 bp of sequence
INFO - read 1 contig(s) from 1 input annotation and/or sequence file(s)
INFO - finished drawing figure using ./conf/genes-percentGC-GCskew-1.cfg
Step 2: Convert the SVG file to PNG, PDF, or JPEG (optional)
SVG files can be viewed directly in many modern web browsers, or opened in image-manipulation programs such as Adobe Illustrator, Inkscape, and The GNU Image Manipulation Program (GIMP).
However, different applications may vary in how well and/or extensively they implement the SVG specification, so it may sometimes be preferable to convert Circleator’s SVG output into a different format, such as PDF, PNG, or JPEG. A script included in the Circleator package uses the SVG rasterizer from the Apache Batik SVG Toolkit to do just this. To run the conversion script, simply specify the path to the input SVG file and the desired output format (either ‘pdf’, ‘png’, or ‘jpeg’), as in the following 3 commands:
/usr/local/bin/rasterize-svg fig1.svg pdf
/usr/local/bin/rasterize-svg fig1.svg png
/usr/local/bin/rasterize-svg fig1.svg jpeg
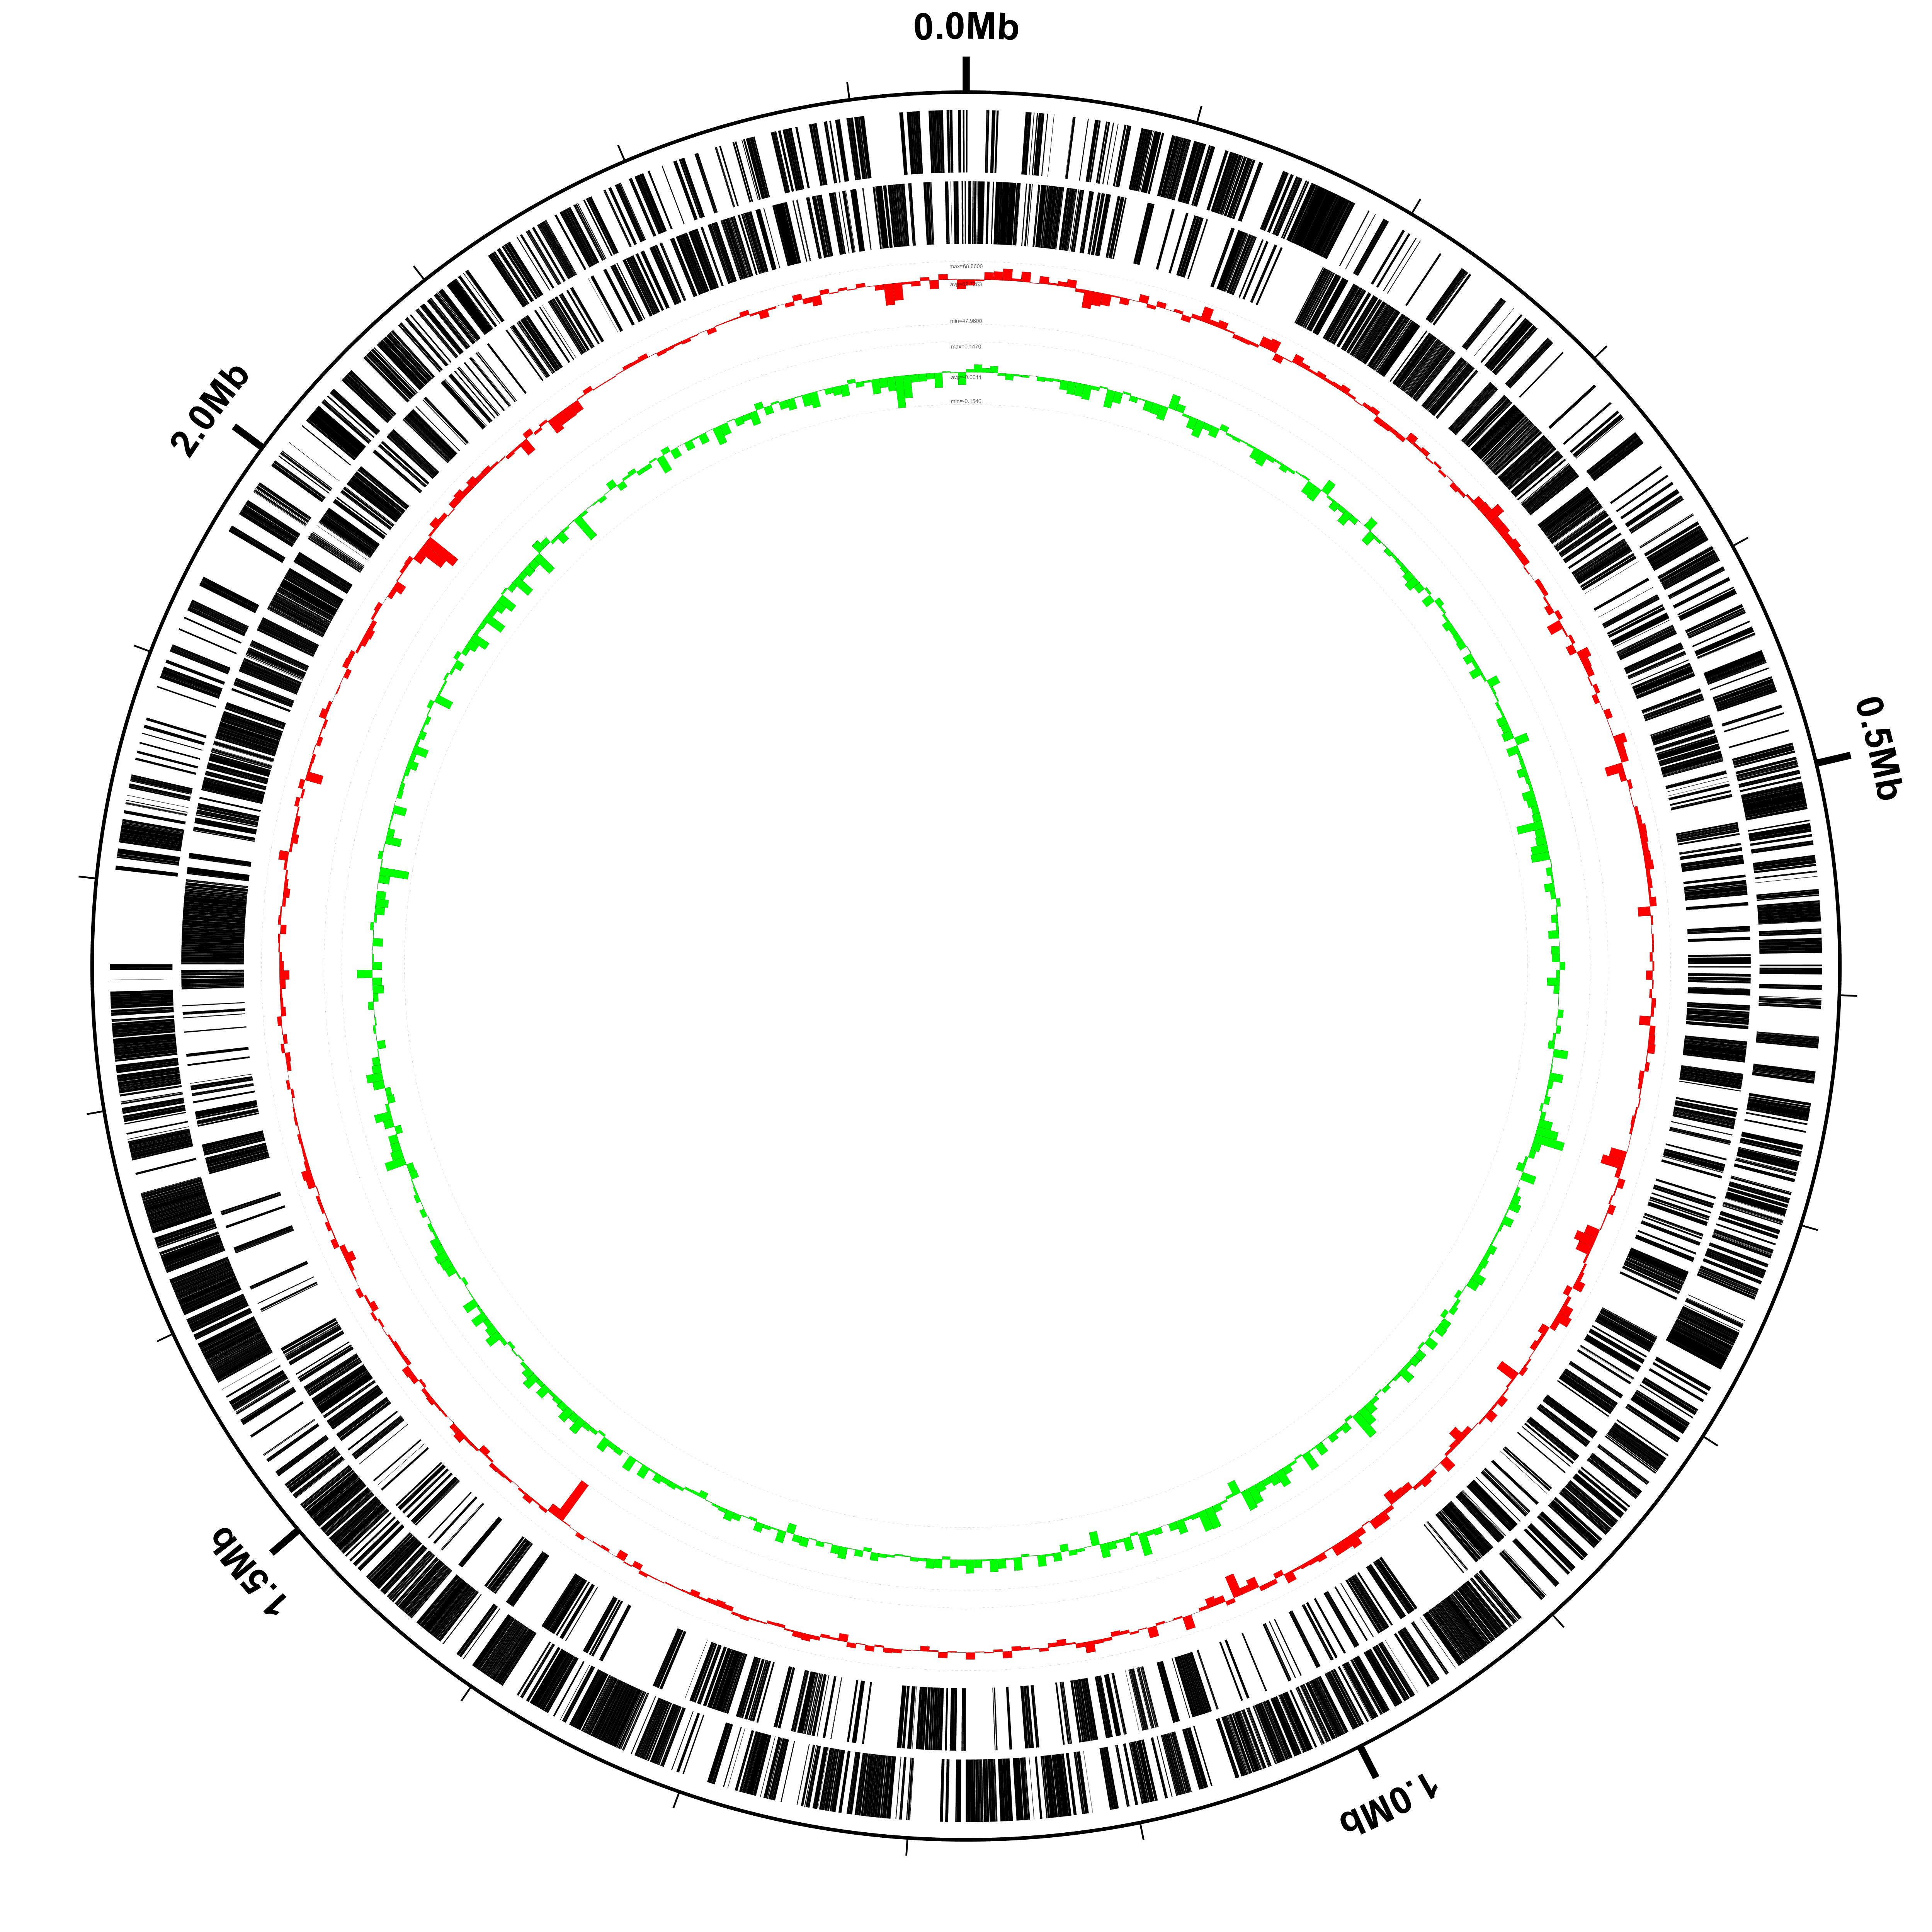
This is what our fig1.svg looks like after converting it to PNG format with rasterize-svg (and here’s
a larger version showing greater detail):
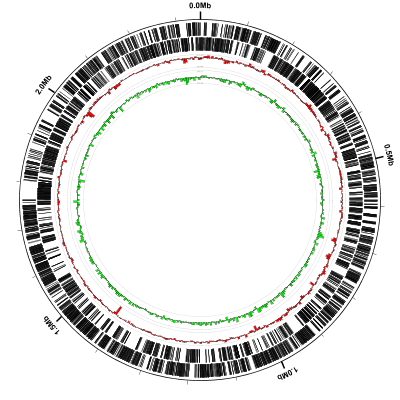
The configuration file that we used in this example is composed
entirely of predefined tracks
By default Circleator plots the first track in the configuration file
(coords in this example) on the outside of the circle and then
places each successive track inside the previous one. Here is the
entire configuration file, with comments (the lines that begin with
#) added for clarity. See if you can match up each line of the
configuration file with one of the concentric circles in the figure
above:
# the outer circle with tick marks every 100kb and a coordinate label every 500kb:
coords
# a small gap between the previous track and the next:
small-cgap
# all forward-strand gene features (in CM000961.gbk) drawn as black curved rectangles
genes-fwd
# a very small gap between the previous track and the next:
tiny-cgap
# all reverse-strand gene features (in CM000961.gbk) drawn as black curved rectangles
genes-rev
small-cgap
# percent GC graph using nonoverlapping 5kb windows with range set to the observed min & max values.
# (dfa = display Difference From Average)
%GCmin-max-dfa
small-cgap
# GC-skew graph using nonoverlapping 5kb windows with range set to the observed min & max values.
# (df0 = display Difference From 0)
GCskew-min-max-df0
Command Line Options
For a full list of the command line options that the Circleator
supports, invoke the tool with the --help option or use man
circleator to view the manual page:
/usr/local/bin/circleator --help
Here are a few key options that may be useful in addition to the basic ones covered in the example above:
-
--rotate_degrees=180
Optional. Number of degrees (from 0 - 360) to rotate the circle in the clockwise direction. Default is 0, meaning that 0bp will appear at the top center of the circle. -
--pad=200
Amount of padding/blank space to leave on each side of the figure. Default is 400. The main reason for increasing this value is to reserve additional space for long labels (e.g., gene product names) displayed around the outside of a figure withlabel-type=spoke. For reference the circle itself has a default diameter of 2400. -
--contig_list=contigs.txt
Optional. Path to a single tab-delimited file that lists one or more contigs that should be joined into a single circular pseudomolecule by inserting gaps of size--contig_gap_size. Each line of the file must contain 5 or 6 tab-delimited fields, some of which may be left empty. These fields are as follows:- contig id - the name/id of the sequence (optional)
- display name - a distinct display name to be used for the contig in figures (optional)
- seqlen - the length of the contig in base pairs (optional)
- data file - a contig annotation file in any format accepted by the
--dataoption - sequence file - a contig sequence file in any format accepted by the
--sequenceoption - revcomp - placing the keyword
revcompin the optional 6th field indicates that the sequence and/or annotation should be reverse-complemented.
Note that if the
--contig_listoption is provided then the--data,--sequence, and--seqlenoptions will all be ignored. The contig id may also be one of the folowing special values:-
genome- adds a ‘genome’ feature with name display name, covering all the preceding contigs that are not already associated with agenometag. -
gap- inserts a gap of size seqlen between the previous contig and the next. If this keyword is used at any point in the file then--contig_gap_sizewill be ignored and Circleator will not automatically generate any gaps.
-
--contig_gap_size=2000
Optional. Size of the gap, in base pairs, to place between each pair of contigs listed in--contig_list -
--no_seq
Optional. Set this if no sequence is available for the contigs in--contig_list, or if sequence is available but the sequences are too large to concatenate into a single pseudomolecule in BioPerl. -
--log=logfile.txt
Redirects the log/debug output to the named file.
Configuration File
A Circleator figure is composed of several concentric rings, each of
which depicts a specific subset or aspect of the data plotted against
a circular reference coordinate system. The rings in the figure are
called “tracks”, a term adopted from linear genome visualization
tools. The Circleator configuration file, specified by the --config
command line option, is a plain text file in which each line
corresponds to a single track in the resulting figure. By default as
the Circleator reads through the configuration file it places the
first track on the very outside of the circle, with successive tracks
occupying smaller and smaller inner rings until the available space is
exhausted. There are a number of ways to obtain a Circleator
configuration file, one of which is to simply use one of the
predefined configuration files distributed with the software, as in
our example above. Here is a more complete list of options to
consider:
- Use one of the predefined configuration files without making any changes.
- Make a copy of a predefined configuration file and modify it as needed.
- Create a new configuration file from scratch.
In terms of defining tracks within the configuration file there are also several options available:
- Choose tracks from the library of customizable predefined track types.
- Create user-defined track types based on the Circleator’s built-in graphical drawing primitives (glyphs).
- Use the Circleator’s Perl API to define entirely new glyphs.
For more information on writing and editing configuration files please see the detailed configuration file documentation.
Input Data
The Circleator is designed to address a variety of use cases, from displaying single circular microbial genomes to making figures for large multichromosomal eukaryotic genomes. There are several different ways to provide it with the sequence and/or annotation, but the basic choice to make is whether the reference coordinate system for the figure will be based on a single contiguous genome sequence (possibly containing some internal gaps of known lengths) or based on multiple contiguous genome sequences, separated by artificial gaps of arbitrary size:
Single Sequence
The simple example shown above uses the --data command line option
to generate a figure for a single sequence entry. This handles the
case where both the sequence and its associated annotation (assuming
there is any) are both in the same file. Not all file formats support
combining sequence and annotation in a single file, however. If the
sequence and annotation are in separate files then they can be passed
to the Circleator separately, using the --data and --sequence
options. It is also possible to run the Circleator by giving it only
an annotation input file and no sequence input file. In this case one
restriction is that if the annotation file does not specify the length
of the underlying sequence then it must be passed to Circleator
explicitly with the --seqlen option.
Multiple Sequences
There are two ways to handle multiple input sequences: they can either be placed into a single BioPerl-supported sequence or
annotation file or they can be kept in separate files. In the former case they are passed to the Circleator
using the --data and/or --sequence options, just as in the
single input sequence case. In the latter case the paths to the various input files must be placed into a tab-delimited flat
file that is then passed to the Circleator’s --contig_list option:
Multiple sequences in one file
The simplest way to display multiple contigs with the Circleator is to use an input file (e.g., a GenBank flat file) that contains
multiple sequence entries. The file is still passed to the Circleator with the --data option, but the Circleator will automatically concatenate
all the sequences in the input file into a single pseudomolecule, placing a gap of size 20000 bp between each adjacent pair of sequences. The inserted
gap size can be modified by using the --contig_gap_size option.
Multiple sequences in several files
If, on the other hand, you have multiple sequences split into several files then you can use the --contig_list option in place of the
--data option. The --contig_list option expects to be given the path to a single tab-delimited file that lists
one or more contig annotation and/or sequence files that should be joined into a single circular pseudomolecule. Each line of the
tab-delimited file must contain the following 5 or 6 columns, some of which may be left empty:
- contig id - the name/id of the sequence (optional)
- display name - a distinct display name to be used for the contig in figures (optional)
- seqlen - the length of the contig in base pairs (optional)
- data file - a contig annotation file in any format accepted by
--data - sequence file - a contig sequence file in any format accepted by
--sequence - revcomp - placing the keyword “revcomp” in the optional 6th field indicates that the sequence/annotation should be reverse-complemented.
Note that if the --contig_list option is provided then the --data,
--sequence, and --seqlen options will all be ignored.
