
Coverage Plots Using BAM Files
In this tutorial we’ll look at plotting coverage data from BAM files. We use the term “coverage” rather than “alignment” because Circleator does not support plotting individual alignments directly from BAM format input, but it can generate simple depth-of-coverage plots to help visualize the content of a BAM file. We’ll look at two different ways of making coverage plots from BAM files:
- Using the BAM-specific “BAMCoverage” graph function to plot the contents of a BAM file directly.
- Using the generic “FlatFile” graph function to plot summarized coverage data from a tab-delimited flat file.
It is important to note that both approaches depend in one way or
another on the samtools toolkit. The first method, using the
“BAMCoverage” graph-function, relies on an external call to samtools
mpileup in order to generate the required coverage data. This means
that: 1. Circleator must be able to find the samtools executable in
the current path and; 2. Generating the coverage data can be quite
slow, particularly for large BAM files, and this process must be
repeated every time Circleator is run. The second method, using the
“FlatFile” graph-function, reads the coverage data from a
tab-delimited flat file. That flat file, however, must be generated
prior to running Circleator, and the recommended method for doing this
entails the use of a small C program (available on GitHub) that must
be compiled against the samtools package. The main advantage of this
approach is that the expense of building the pileup and computing the
coverage depths need be incurred only once per input BAM file.
Before proceeding with the tutorial, please make sure that you have Circleator installed as described in the Circleator Installation Guide.
Outline
-
Example 1: Enterobacteria phage lambda: BAM file coverage using “BAMCoverage”
-
Example 2: Enterobacteria phage lambda: BAM file coverage using “FlatFile”
- Example 3: Figure 1A from the 2014 Circleator Applications Note
Example 1: Enterobacteria phage lambda: BAM file coverage using “BAMCoverage”
Download the phage genome’s FASTA file
The RefSeq accession number for the Enterobacteria phage lambda genome sequence is NC_001416.1. For convenience we’ve downloaded the corresponding genomic sequence FASTA file and placed a copy on the same web server as the Circleator tutorials. Download the file below by right-clicking on the link and selecting “Save link as” or “Save as”. Save the file somewhere accessible because we’ll be using it as one of the inputs to Circleator:
Download the BAM files
The three BAM files we’ll be using were generated using Bowtie2 and the synthetic example data distributed along with it. You can either download the pregenerated BAM files using the links below, or download and install Bowtie2 and run the example alignments as described in the Bowtie2 documentation. Note that if you’re taking this approach then the output .sam files should be converted to .bam and sorted, as we’ve done for the pregenerated files below:
Download the Circleator configuration file
Here is the first Circleator configuration file for this example. Download it by right-clicking on the following link and selecting “Save link as” or “Save as”:
Take a look at the content of this file e.g., by using the cat command in Linux/Unix:
$ cat coverage-ex1.txt
Notice that:
-
Several of the tracks have been customized to account for the fact that the phage lambda genome is only about 50kb long, because most of the track default values are tailored to sequences of a megabase or more. For example, note the window-size option (set to 100bp) on all the graph tracks, and the tick-interval, label-interval, and label-units options on the coords track (the labeled circle around the outside of the figure):
# percent GC plot %GC0-100 innerf=1.03,opacity=0.6,heightf=0.07,graph-min=0,graph-max=100,window-size=100 # outer coordinate circle coords outerf=1.05,tick-interval=1000,label-interval=5000,label-units=kb -
Several lines are dedicated to showing the protein-coding genes, rRNAs, and tRNAs, but (as we will see in a moment) none of these features show up in the figure, because we’re passing a plain FASTA file to the Circleator
--dataoption:# forward and reverse strand genes small-cgap genes-fwd heightf=0.05 tRNAs-fwd heightf=0.05,innerf=same rRNAs-fwd heightf=0.05,innerf=same tiny-cgap genes-rev heightf=0.05 tRNAs-rev heightf=0.05,innerf=same rRNAs-rev heightf=0.05,innerf=same -
Three lines at the end of the file (separated by small-cgaps) load and display coverage data from the BAM files:
small-cgap new bam1 graph 0.14 graph-function=BAMCoverage,bam-file=eg1.sorted.bam,bam-seqid=gi|9626243|ref|NC_001416.1|,graph-min=0,graph-max=data_max,window-size=100,color1=#3aa0d5 small-cgap new bam2 graph 0.14 graph-function=BAMCoverage,bam-file=eg2.sorted.bam,bam-seqid=gi|9626243|ref|NC_001416.1|,graph-min=0,graph-max=data_max,window-size=100,color1=#3aa0d5 small-cgap new bam3 graph 0.14 graph-function=BAMCoverage,bam-file=eg3.sorted.bam,bam-seqid=gi|9626243|ref|NC_001416.1|,graph-min=0,graph-max=data_max,window-size=100,color1=#3aa0d5We’re explicitly setting graph-min=0 and graph-max=data_max, which means that the y-axis for each graph will range from 0 to the maximum observed coverage depth, for that particular BAM file. In some situations it may make more sense to set the graph-max to the same value to make it easier to compare multiple graphs. Also note the use of the bam-seqid option, which tells the BAMCoverage parser to skip any lines in the BAM file that do not refer to the named reference sequence (“gi|9626243|ref|NC_001416.1|”). In these BAM files there is only one reference sequence, but in a larger BAM file it may be helpful to ignore alignments to reference sequences that are not being plotted in Circleator. There is also a bam-seqregex option, which allows one to use a regular expression to select multiple reference sequences from the BAM File.
Run Circleator
Now that we have the reference sequence (lambda_virus.fa), configuration file (coverage-ex1.txt) and the
three BAM files that it references (eg1.sorted.bam,eg2.sorted.bam,eg3.sorted.bam), we can run Circleator:
$ circleator --data=lambda_virus.fa --config=coverage-ex1.txt > coverage-ex1.svg
The output should look something like this. Note that you can also see some messages produced by the
samtools mpileup command that is invoked by the BAMCoverage function:
INFO - started drawing figure using coverage-ex1.txt
INFO - reading from annot_file=./lambda_virus.fa, seq_file=, with seqlen=
INFO - gi|9626243|ref|NC_001416.1|: 0 feature(s) and 48502 bp of sequence
INFO - read 1 contig(s) from 1 input annotation and/or sequence file(s)
[mpileup] 1 samples in 1 input files
<mpileup> Set max per-file depth to 8000
INFO - parsed 48502/48502 line(s) from samtools mpileup eg1.sorted.bam |
[mpileup] 1 samples in 1 input files
<mpileup> Set max per-file depth to 8000
INFO - parsed 48502/48502 line(s) from samtools mpileup eg2.sorted.bam |
[mpileup] 1 samples in 1 input files
<mpileup> Set max per-file depth to 8000
INFO - parsed 48502/48502 line(s) from samtools mpileup eg3.sorted.bam |
INFO - finished drawing figure using coverage-ex1.txt
Convert the figure from SVG to PNG
If everything looks good so far then use rasterize-svg to convert the SVG to a PNG file:
rasterize-svg coverage-ex1.svg png 3000 3000
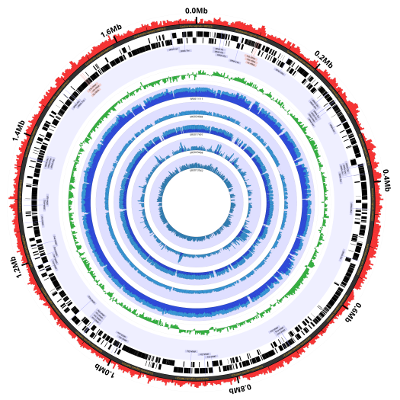
Here’s what the result should look like:
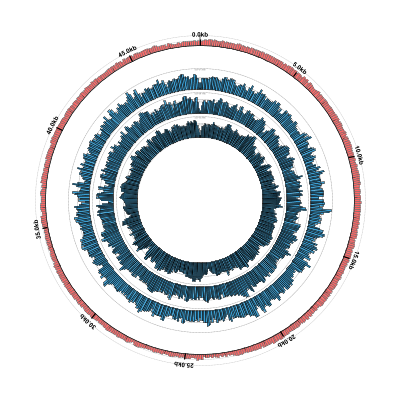
It looks pretty good but, as we noted earlier, the phage genes aren’t showing up because we only gave Circleator a genomic sequence FASTA file for the reference genome, rather than a GenBank file containing annotated genes. Let’s make this switch.
Download the phage genome’s GenBank flat file
The RefSeq accession number for the Enterobacteria phage lambda genome sequence is NC_001416.1. Here’s the corresponding GenBank flat file: download it by right-clicking on the link and selecting “Save link as” or “Save as”.
Run Circleator again
Run Circleator. We shouldn’t have to change the configuration file because it already contains lines to display the reference genes:
$ circleator --data=NC_001416.1.gb --config=coverage-ex1.txt > coverage-ex1-gb.svg
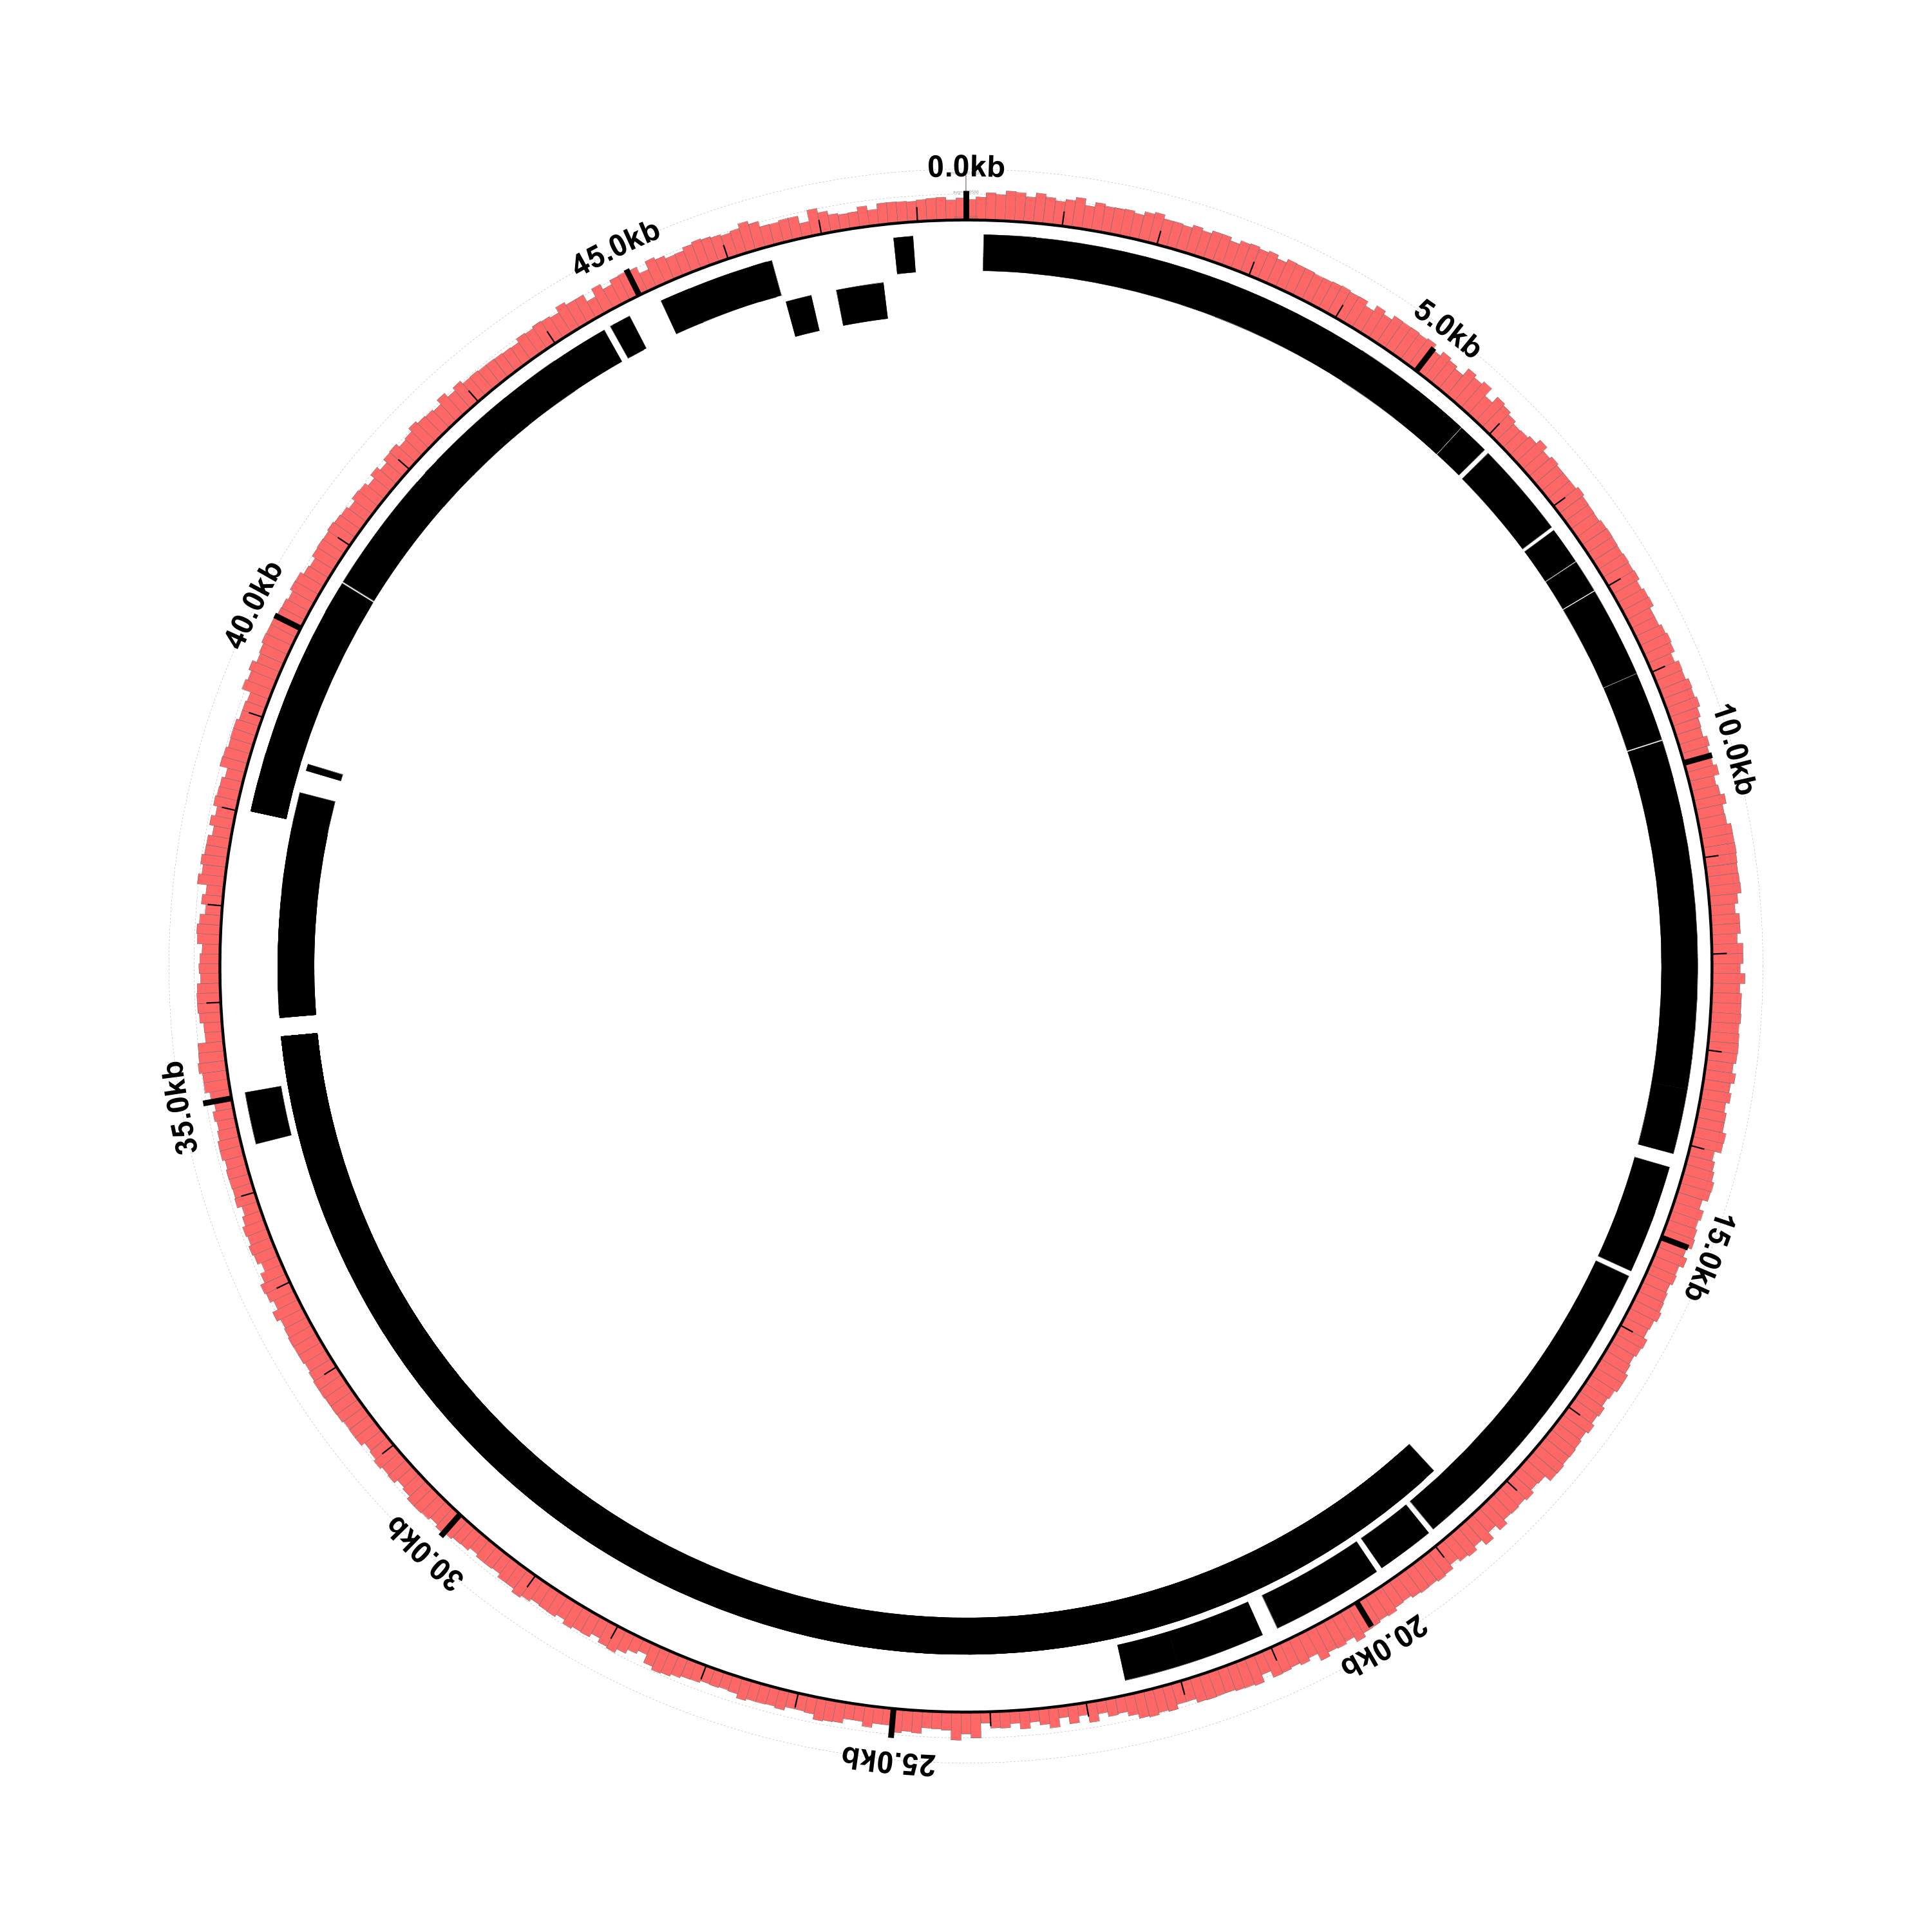
Don’t worry about the errors, we’ll get to those in a minute. Convert the SVG to PNG and look at the result:
$ rasterize-svg coverage-ex1-gb.svg png 3000 3000
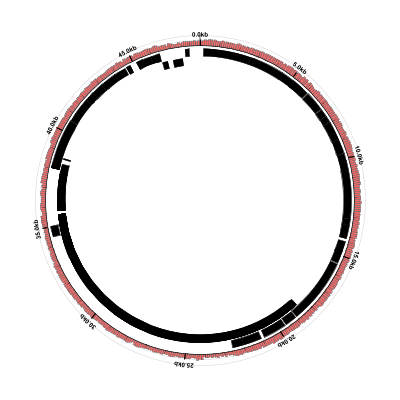
The genes are there now, but the coverage plots have disappeared. Looking at the Circleator output from this run, there are some “WARN” and “ERROR” lines that weren’t there before:
INFO - started drawing figure using coverage-ex1.txt
INFO - reading from annot_file=./NC_001416.1.gb, seq_file=, with seqlen=
INFO - NC_001416: 288 feature(s) and 48502 bp of sequence
INFO - read 1 contig(s) from 1 input annotation and/or sequence file(s)
[mpileup] 1 samples in 1 input files
<mpileup> Set max per-file depth to 8000
WARN - no offset found for gi|9626243|ref|NC_001416.1|
INFO - parsed 48502/48502 line(s) from samtools mpileup eg1.sorted.bam |
ERROR - can't draw bar graph on track 12 using Circleator::SeqFunction::BAMCoverage: graph-max == graph-min
[mpileup] 1 samples in 1 input files
<mpileup> Set max per-file depth to 8000
WARN - no offset found for gi|9626243|ref|NC_001416.1|
INFO - parsed 48502/48502 line(s) from samtools mpileup eg2.sorted.bam |
ERROR - can't draw bar graph on track 14 using Circleator::SeqFunction::BAMCoverage: graph-max == graph-min
[mpileup] 1 samples in 1 input files
<mpileup> Set max per-file depth to 8000
WARN - no offset found for gi|9626243|ref|NC_001416.1|
INFO - parsed 48502/48502 line(s) from samtools mpileup eg3.sorted.bam |
ERROR - can't draw bar graph on track 16 using Circleator::SeqFunction::BAMCoverage: graph-max == graph-min
INFO - finished drawing figure using coverage-ex1.txt
The “WARN” lines are actually the important ones:
WARN - no offset found for gi|9626243|ref|NC_001416.1|
This means that while Circleator was reading the BAM file (with reference sequence id = “gi|9626243|ref|NC_001416.1|”), it wasn’t able to find the same sequence id in the reference genome (i.e., it couldn’t find “gi|9626243|ref|NC_001416.1|” in the GenBank file we’re using, although clearly it was able to find it in the FASTA file.) The second warning/error was caused by the first:
ERROR - can't draw bar graph on track 12 using Circleator::SeqFunction::BAMCoverage: graph-max == graph-min
All this means is that Circleator couldn’t figure out what data_max value to use for graph-max, so it used 0, which
doesn’t work, because graph-min is also 0. If it had been able to map any coverage data to the reference then
this wouldn’t have been a problem. This (data not showing up in the Circleator figure) is a fairly common problem and
it’s often due to a mismatch (even a very very slight one) between the reference sequence id that appears in the reference
FASTA or GenBank file, and the reference sequence id that appears in the BAM file, or any other alignment or annotation file
loaded from within the config file rather than with the --data command-line option. In this case the BAM file uses
“gi|9626243|ref|NC_001416.1|” as the reference sequence id, but the GenBank parser uses “NC_001416”, the LOCUS id on the
first line, instead.
Download the sample contig list file
Currently the easiest way to deal with this problem without modifying either the BAM file or the reference GenBank file
is to use Circleator’s --contig_list option, which allows for greater flexibility in specifying the reference sequence(s).
In particular, it allows us to assign a different sequence id to the sequence read from the GenBank flat file (i.e., one
that matches the corresponding BAM file.)
Here’s the contig list file to use:
The format of the contig list file is described in the Circleator built-in help (e.g., run circleator --help) and also
in the documentation. Here we’re using it to specify only: 1. the sequence id we’d like to use instead of
the one that appears in the GenBank file and 2. the path/name of the GenBank file from which to read the reference sequence
and/or annotation.
Run Circleator a third time
Once you’ve downloaded the contig list file, try making the figure again, using the --contig_list option instead of --data:
$ circleator --contig_list=contig-list-ex1-gb.txt --config=coverage-ex1.txt > coverage-ex1-gb-cl.svg
$ rasterize-svg coverage-ex1-gb-cl.svg png 3000 3000
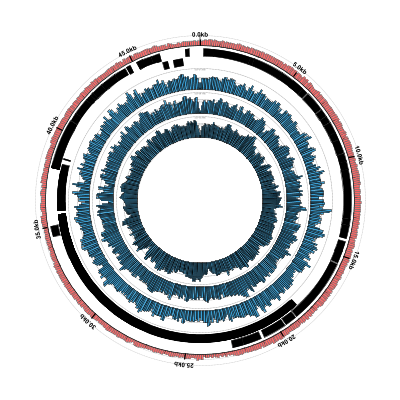
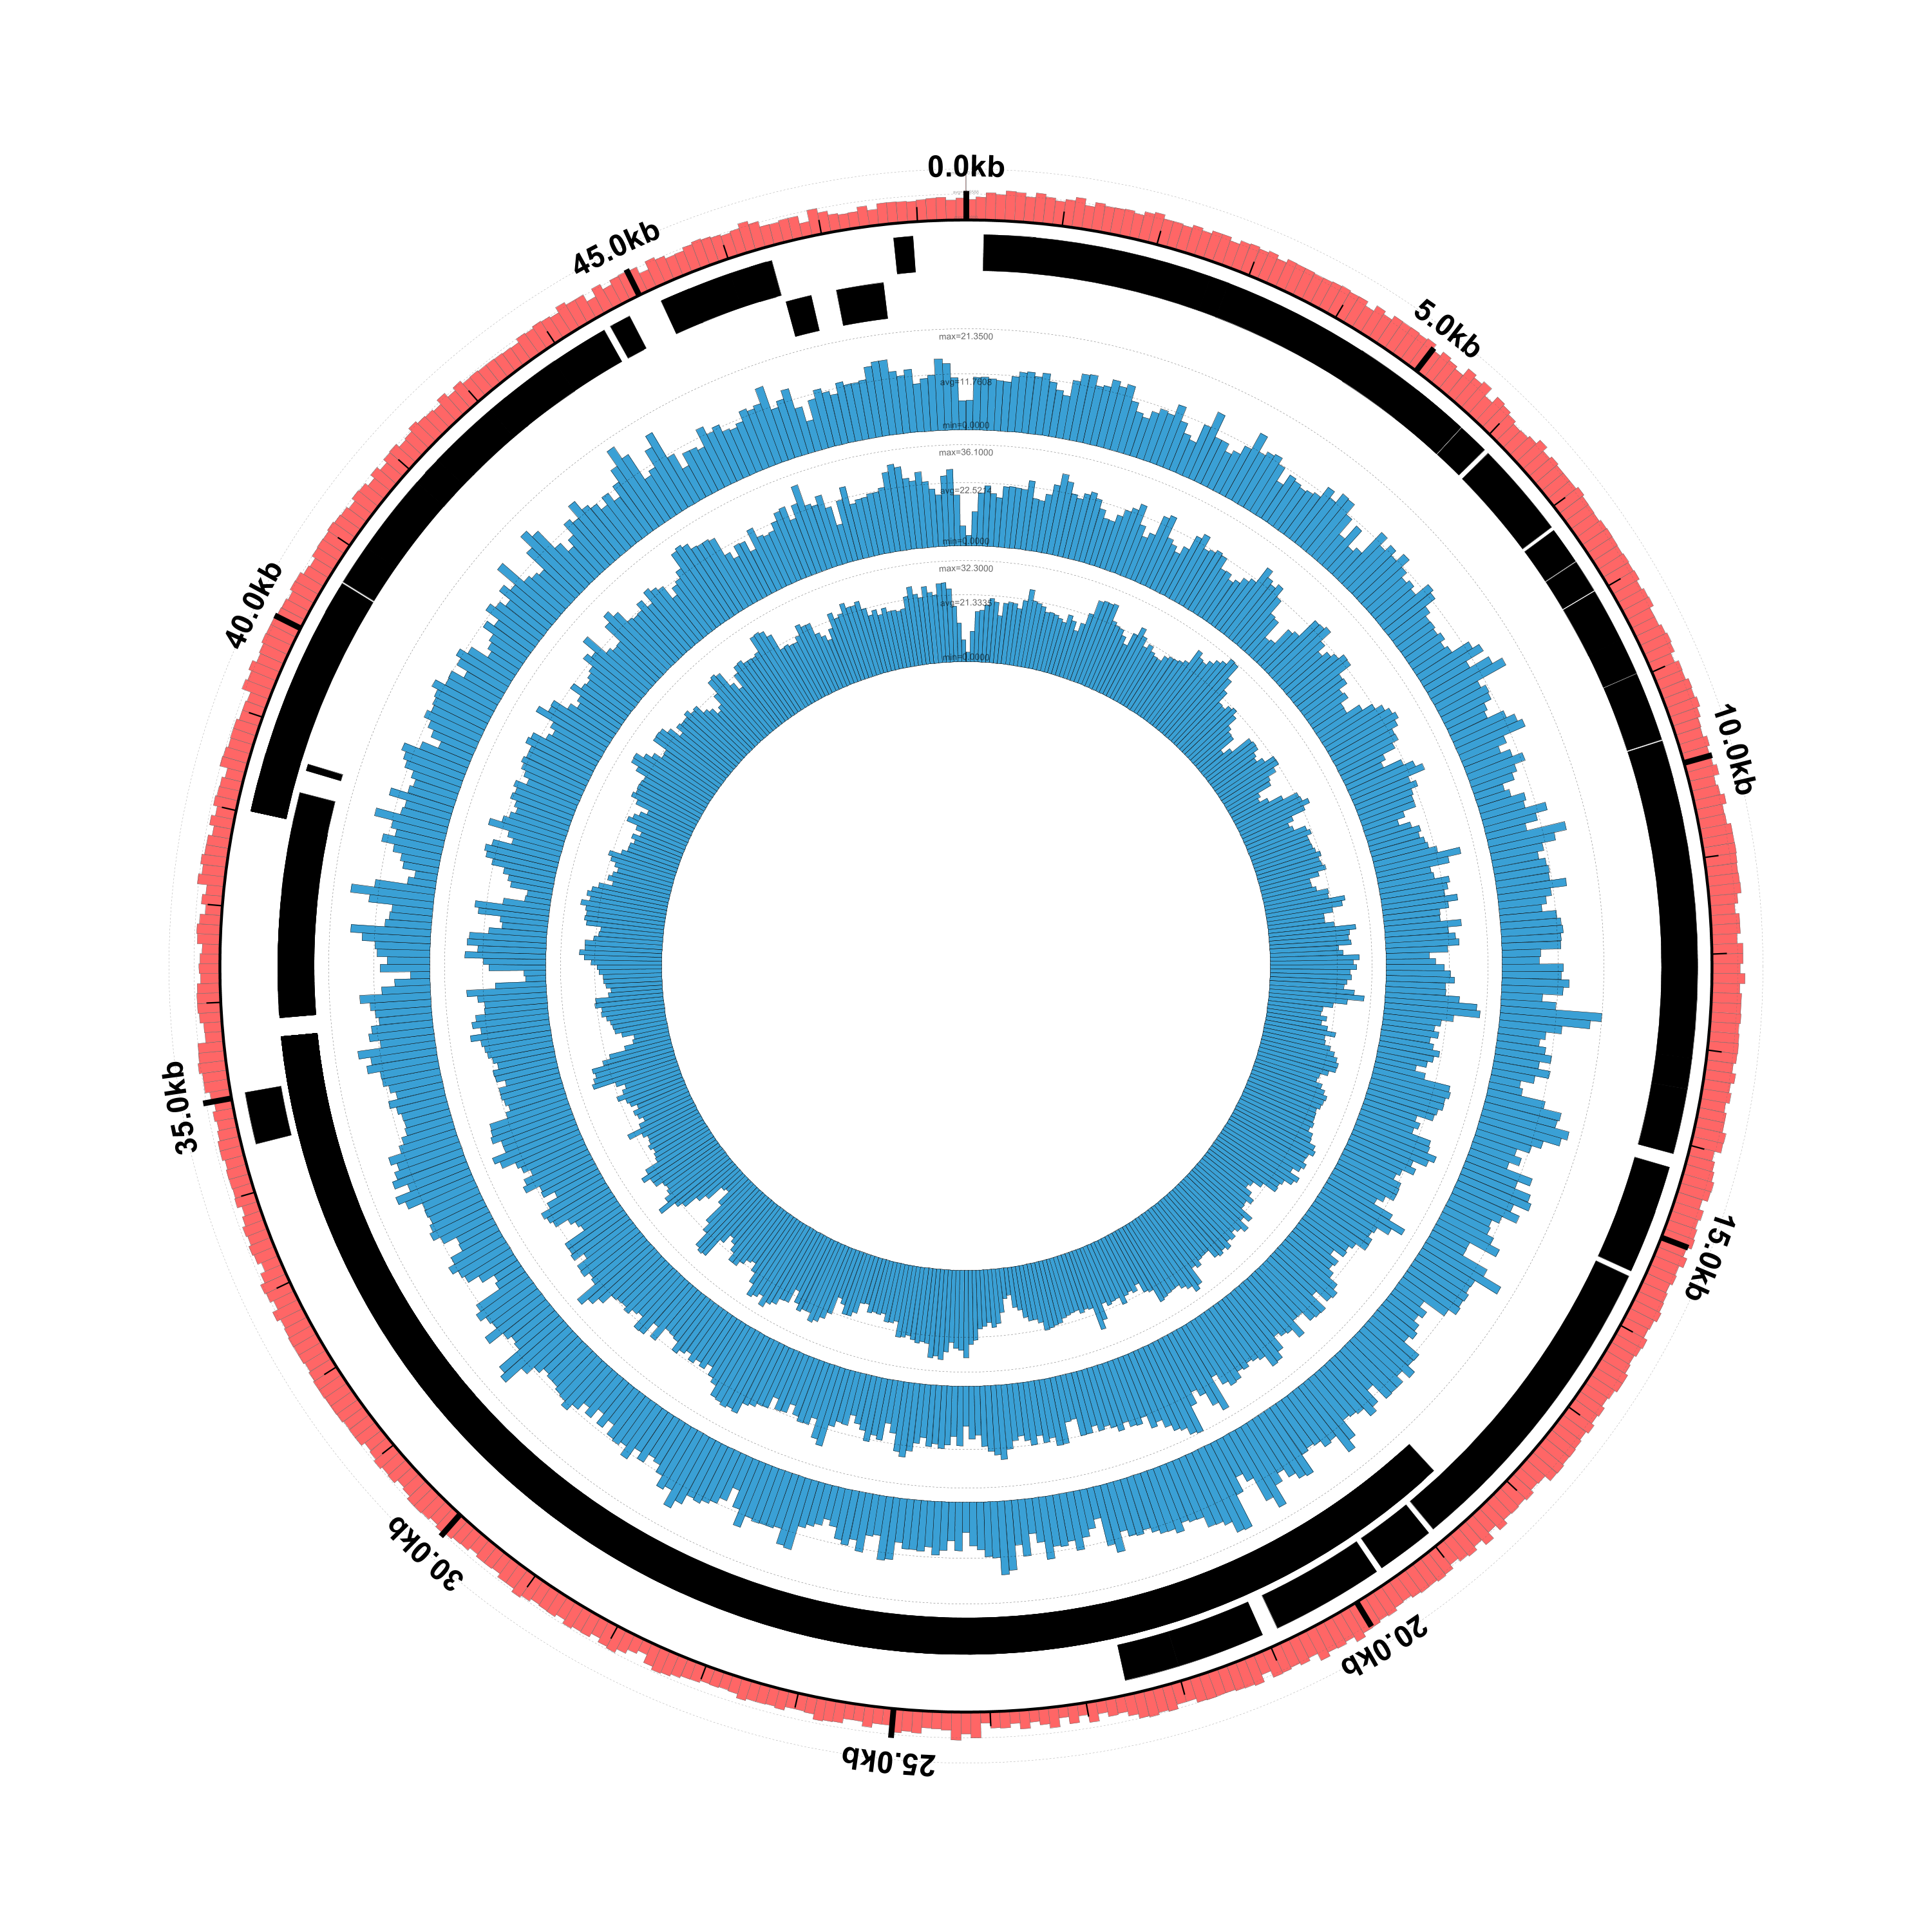
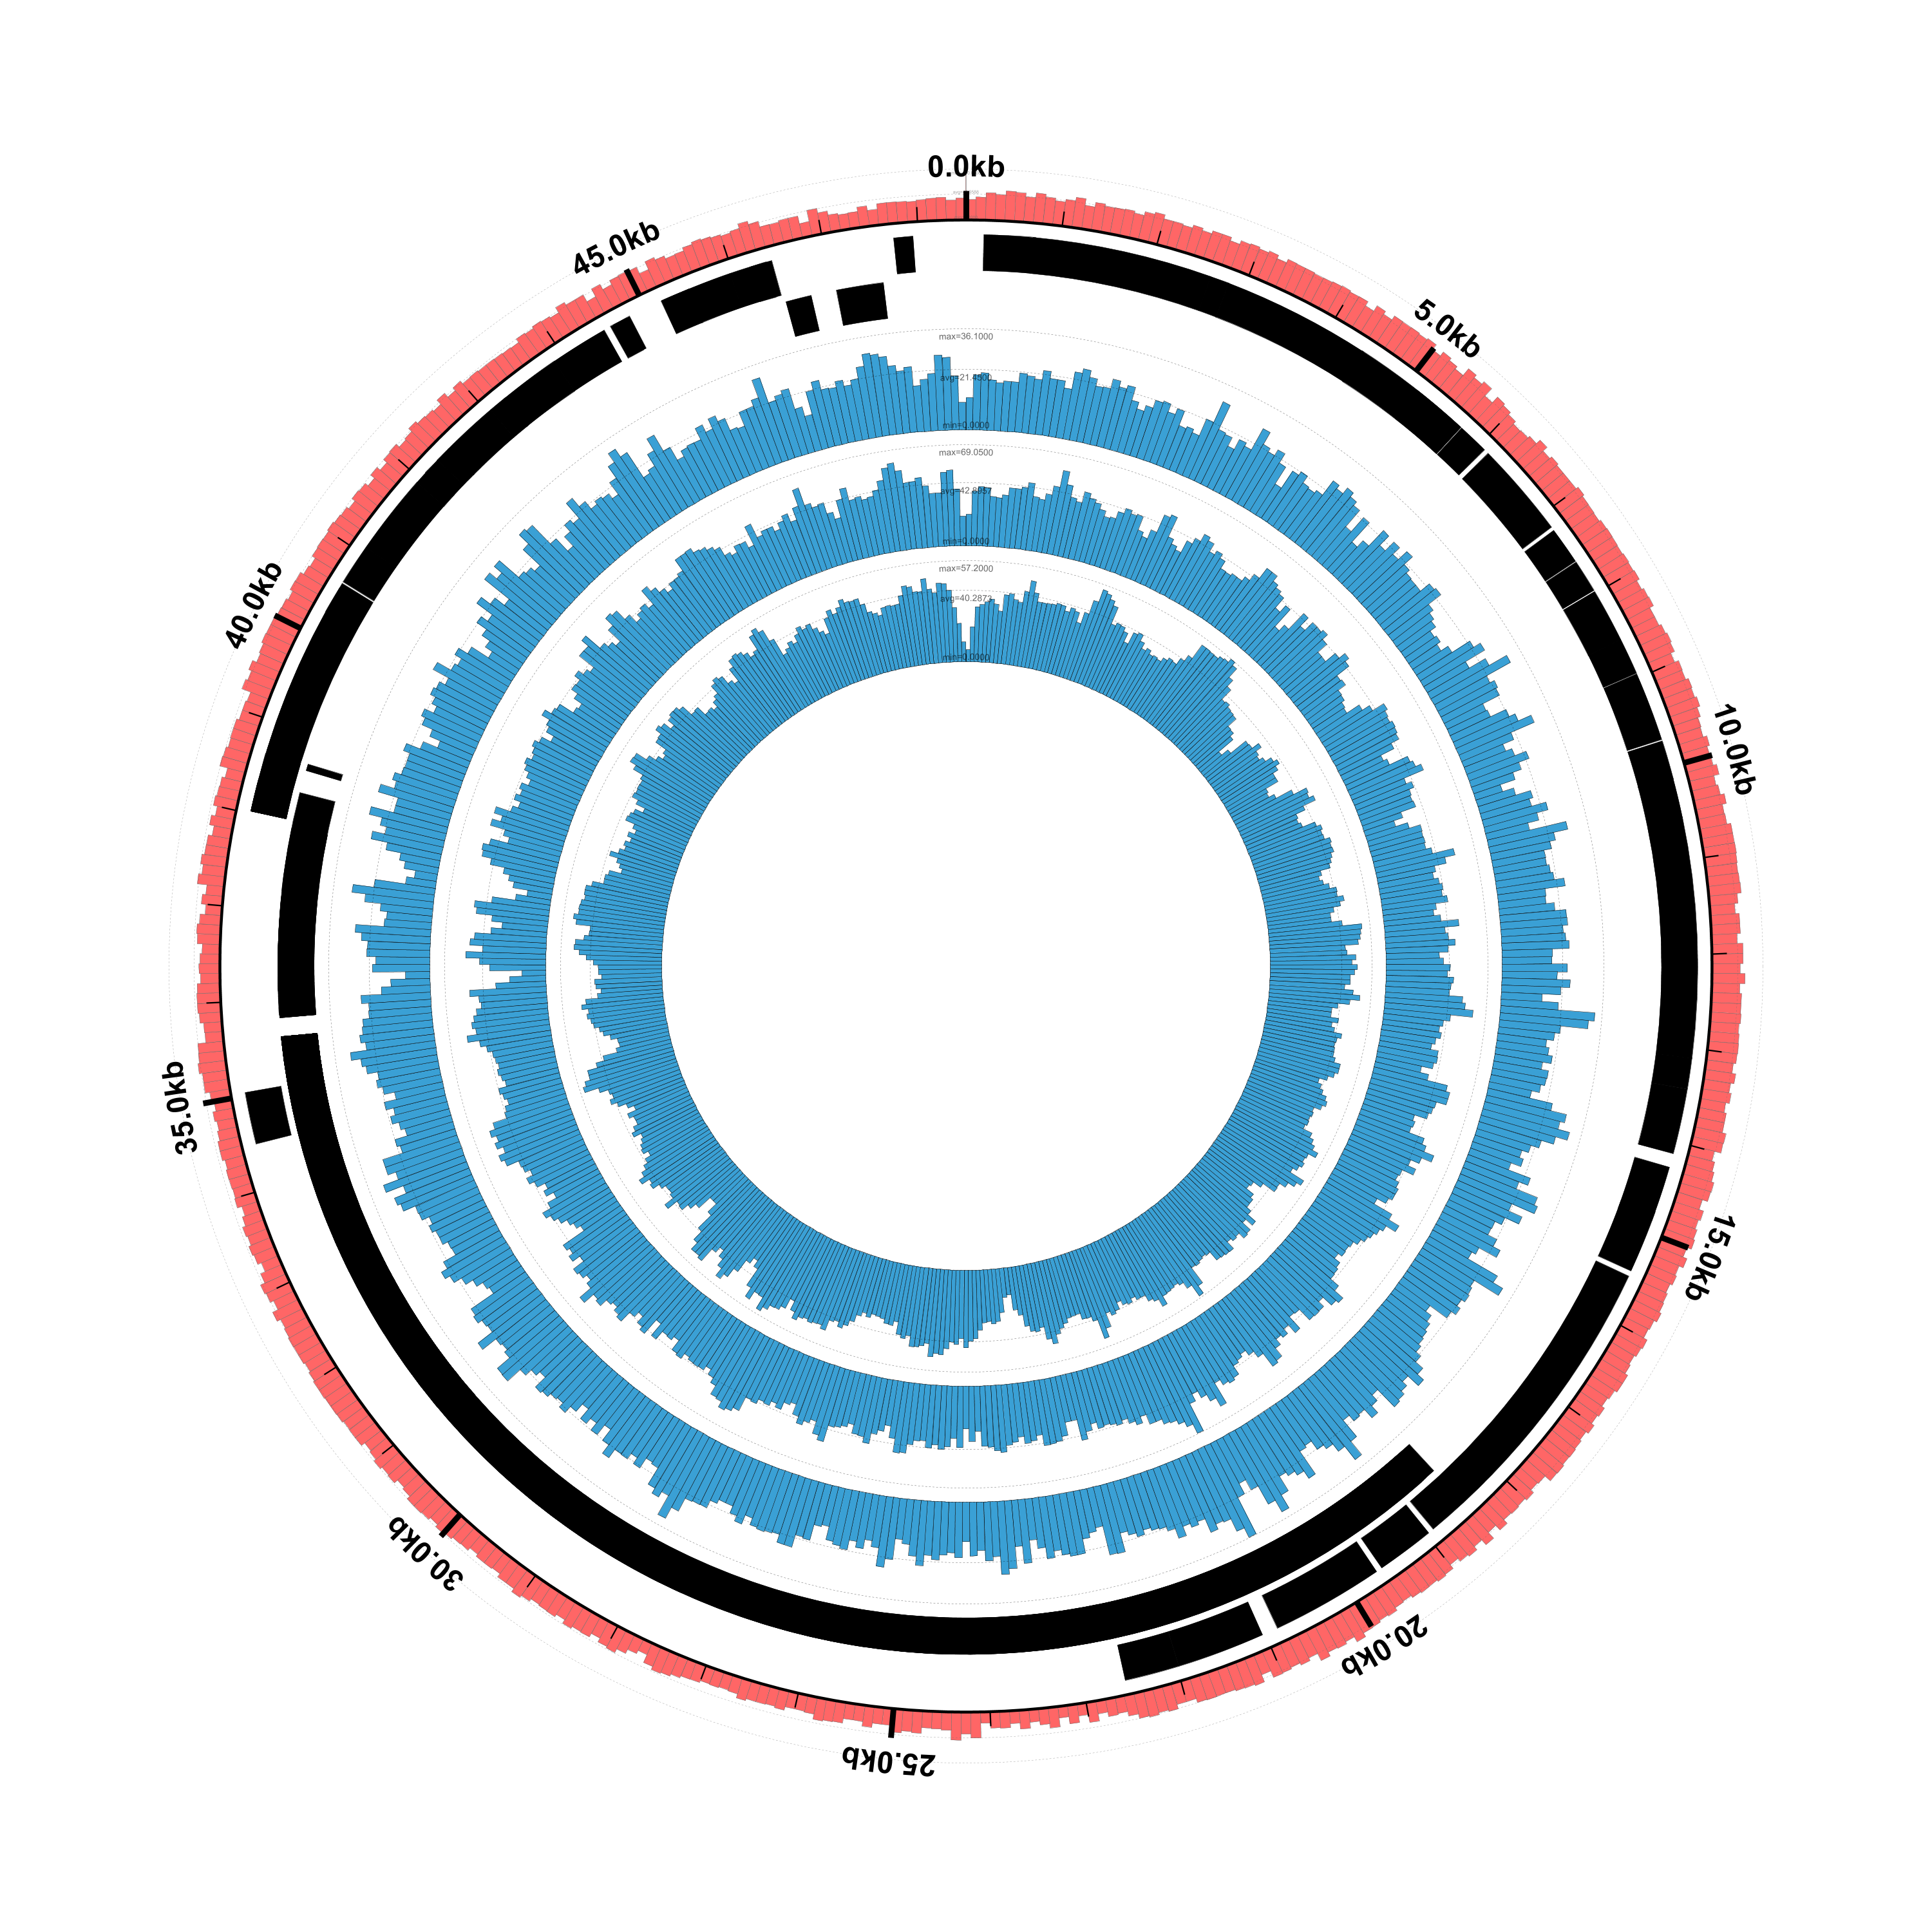
Success! We now have both the coverage plots and reference annotation in a single figure. However,
as we mentioned earlier, using the BAMCoverage function to plot coverage data can be slow,
because it relies on calling samtools mpileup. In the next example we’ll look at making the
same figure, but using the generic FlatFile graph function.
Example 2: Enterobacteria phage lambda: BAM file coverage using “FlatFile”
In this example we’ll assume that you’ve already downloaded the annotation, data, and configuration files used in Example 1. If not, here they are again:
Download and compile bam_get_coverage
We’ll be using an external program (bam_get_coverage) to convert SAM or BAM files into tab-delimited coverage files
that Circleator’s FlatFile graph function can read. bam_get_coverage is a small C-language utility that compiles
against the samtools library and runs on the command line. The source for bam_get_coverage can be found in the
Circleator repository on GitHub:
https://github.com/jonathancrabtree/Circleator/tree/master/util/samtools
Convert BAM files to tab-delimited summary files
First, make sure that the input BAM files are indexed:
samtools index eg1.sorted.bam
samtools index eg2.sorted.bam
samtools index eg3.sorted.bam
Nothing should be printed to the terminal when you run the indexing commands but after they’re done you should see files
with “.bai” suffixes in the same directory as the “.bam” files. Next, once you’ve downloaded and compiled bam_get_coverage,
run it on each of the indexed BAM files.
bam_get_coverage eg1.sorted.bam 100 eg1-coverage-100.txt
bam_get_coverage eg2.sorted.bam 100 eg2-coverage-100.txt
bam_get_coverage eg3.sorted.bam 100 eg3-coverage-100.txt
The 100 here corresponds to the window width that we specified in the Circleator configuration file. One disadvantage of
this approach is that you will have to rerun bam_get_coverage whenever you want to change the window size (i.e., the width
of the bars in the bar graphs.) If you take a look at the content of one of these files you can see that it’s a very simple
tab-delimited format specifying only a sequence range (in 0-based coordinates) and a value associated with each sequence range:
$ head -10 eg1-coverage-100.txt
gi|9626243|ref|NC_001416.1|	0	100	11.520000
gi|9626243|ref|NC_001416.1|	100	200	19.660000
gi|9626243|ref|NC_001416.1|	200	300	20.389999
gi|9626243|ref|NC_001416.1|	300	400	18.040001
gi|9626243|ref|NC_001416.1|	400	500	17.059999
gi|9626243|ref|NC_001416.1|	500	600	17.809999
gi|9626243|ref|NC_001416.1|	600	700	17.780001
gi|9626243|ref|NC_001416.1|	700	800	21.120001
gi|9626243|ref|NC_001416.1|	800	900	20.379999
gi|9626243|ref|NC_001416.1|	900	1000	19.570000
Download the Circleator configuration file
Here is the Circleator configuration file. It’s very similar to the one from example 1, but uses the FlatFile graph function instead of the BAMCoverage function:
Run Circleator
Run Circleator and convert the resulting SVG file to PNG:
$ circleator --contig_list=contig-list-ex1-gb.txt --config=coverage-ex2.txt > coverage-ex2-gb-cl.svg
$ rasterize-svg coverage-ex2-gb-cl.svg png 3000 3000
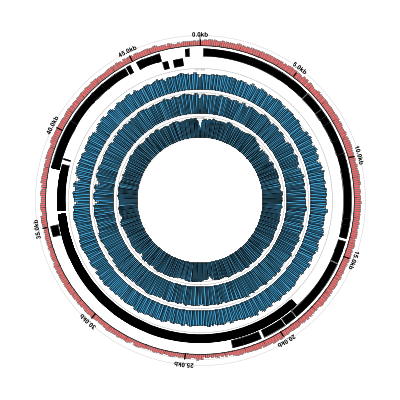
The resulting figure looks very similar, as it should:

Log-transform the coverage files
An advantage of converting the BAM files to tab-delimited flat files is that it makes it easy to transform the coverage values. For example, we can log-transform the data. Here’s a simple Perl script that does just that:
https://github.com/jonathancrabtree/Circleator/tree/master/util
Run it on each of the summarized coverage files:
$./log-transform-coverage.pl eg1-coverage-100.txt
writing eg1-coverage-100-log10.txt
cov_sum=10424.689973, num_lines=486
min_cov=1.000000 max_cov=36.099998 avg_cov=21.45 max_log_cov=1.55750717784502
$./log-transform-coverage.pl eg2-coverage-100.txt
writing eg2-coverage-100-log10.txt
cov_sum=20847.329971, num_lines=486
min_cov=2.000000 max_cov=69.050003 avg_cov=42.90 max_log_cov=1.83916370178335
$./log-transform-coverage.pl eg3-coverage-100.txt
writing eg3-coverage-100-log10.txt
cov_sum=19579.629965, num_lines=486
min_cov=4.000000 max_cov=57.200001 avg_cov=40.29 max_log_cov=1.75739603638558
Or simply download the log-transformed files:
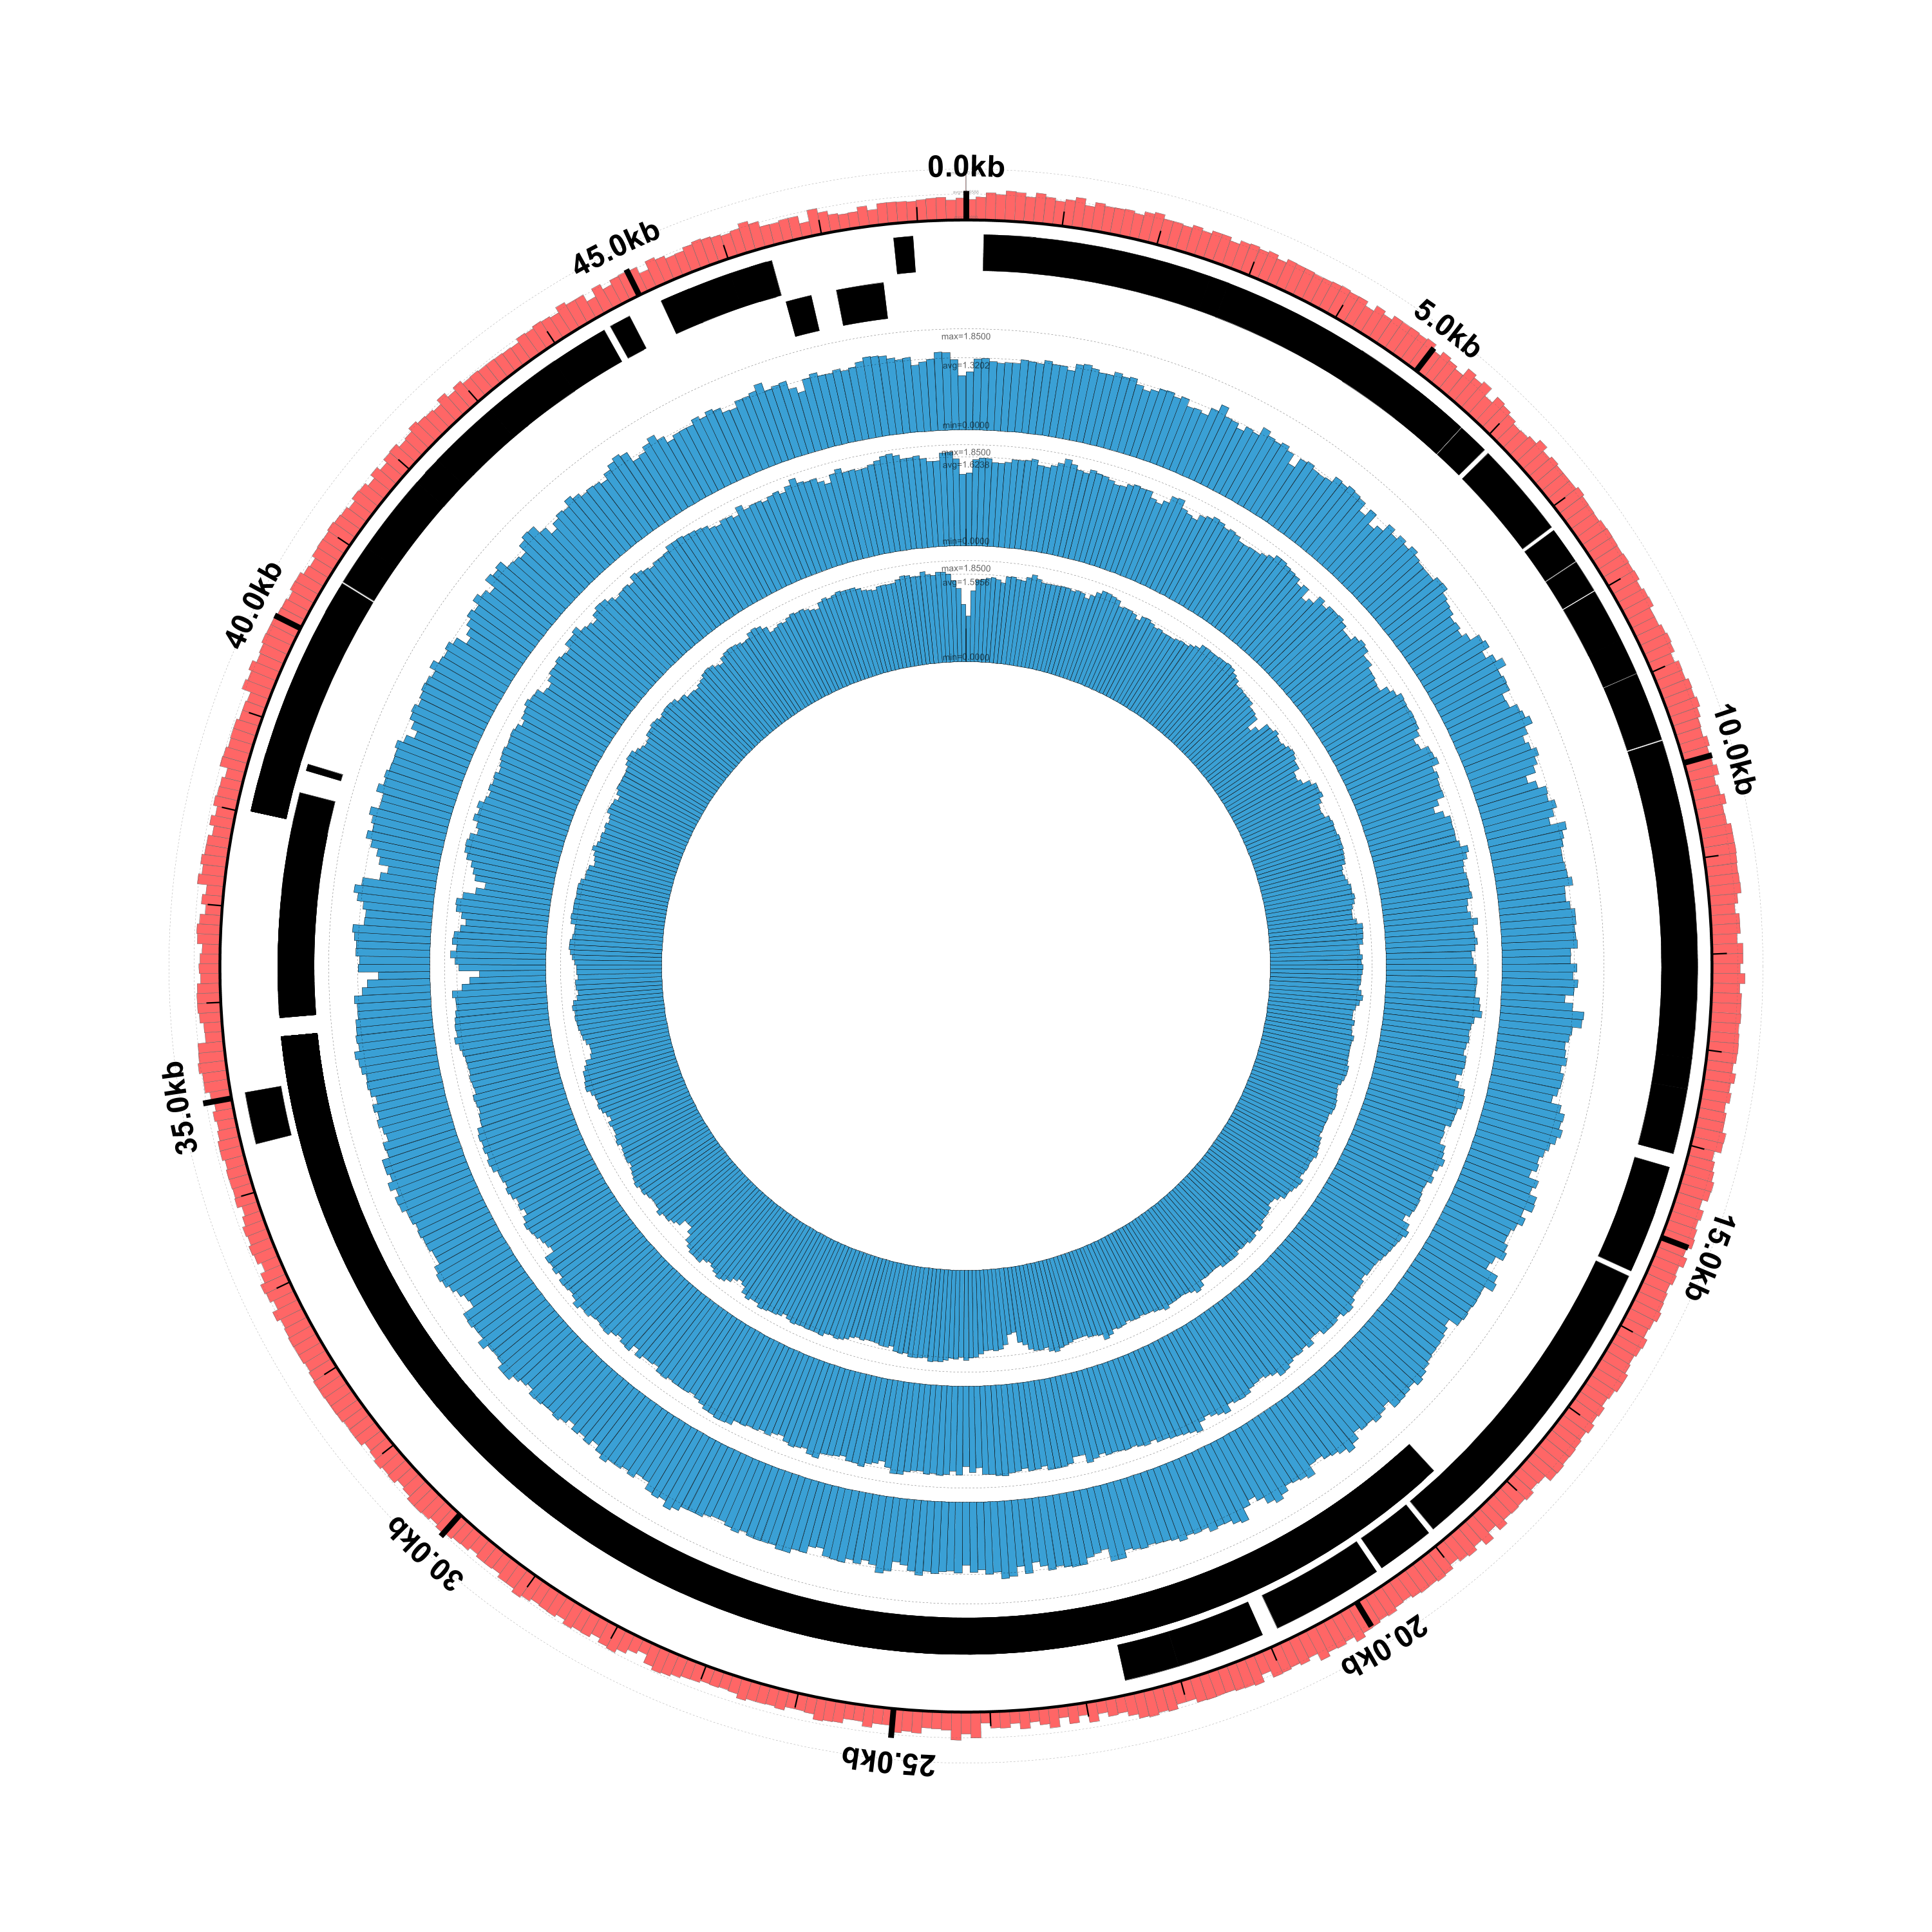
Generate the new figure
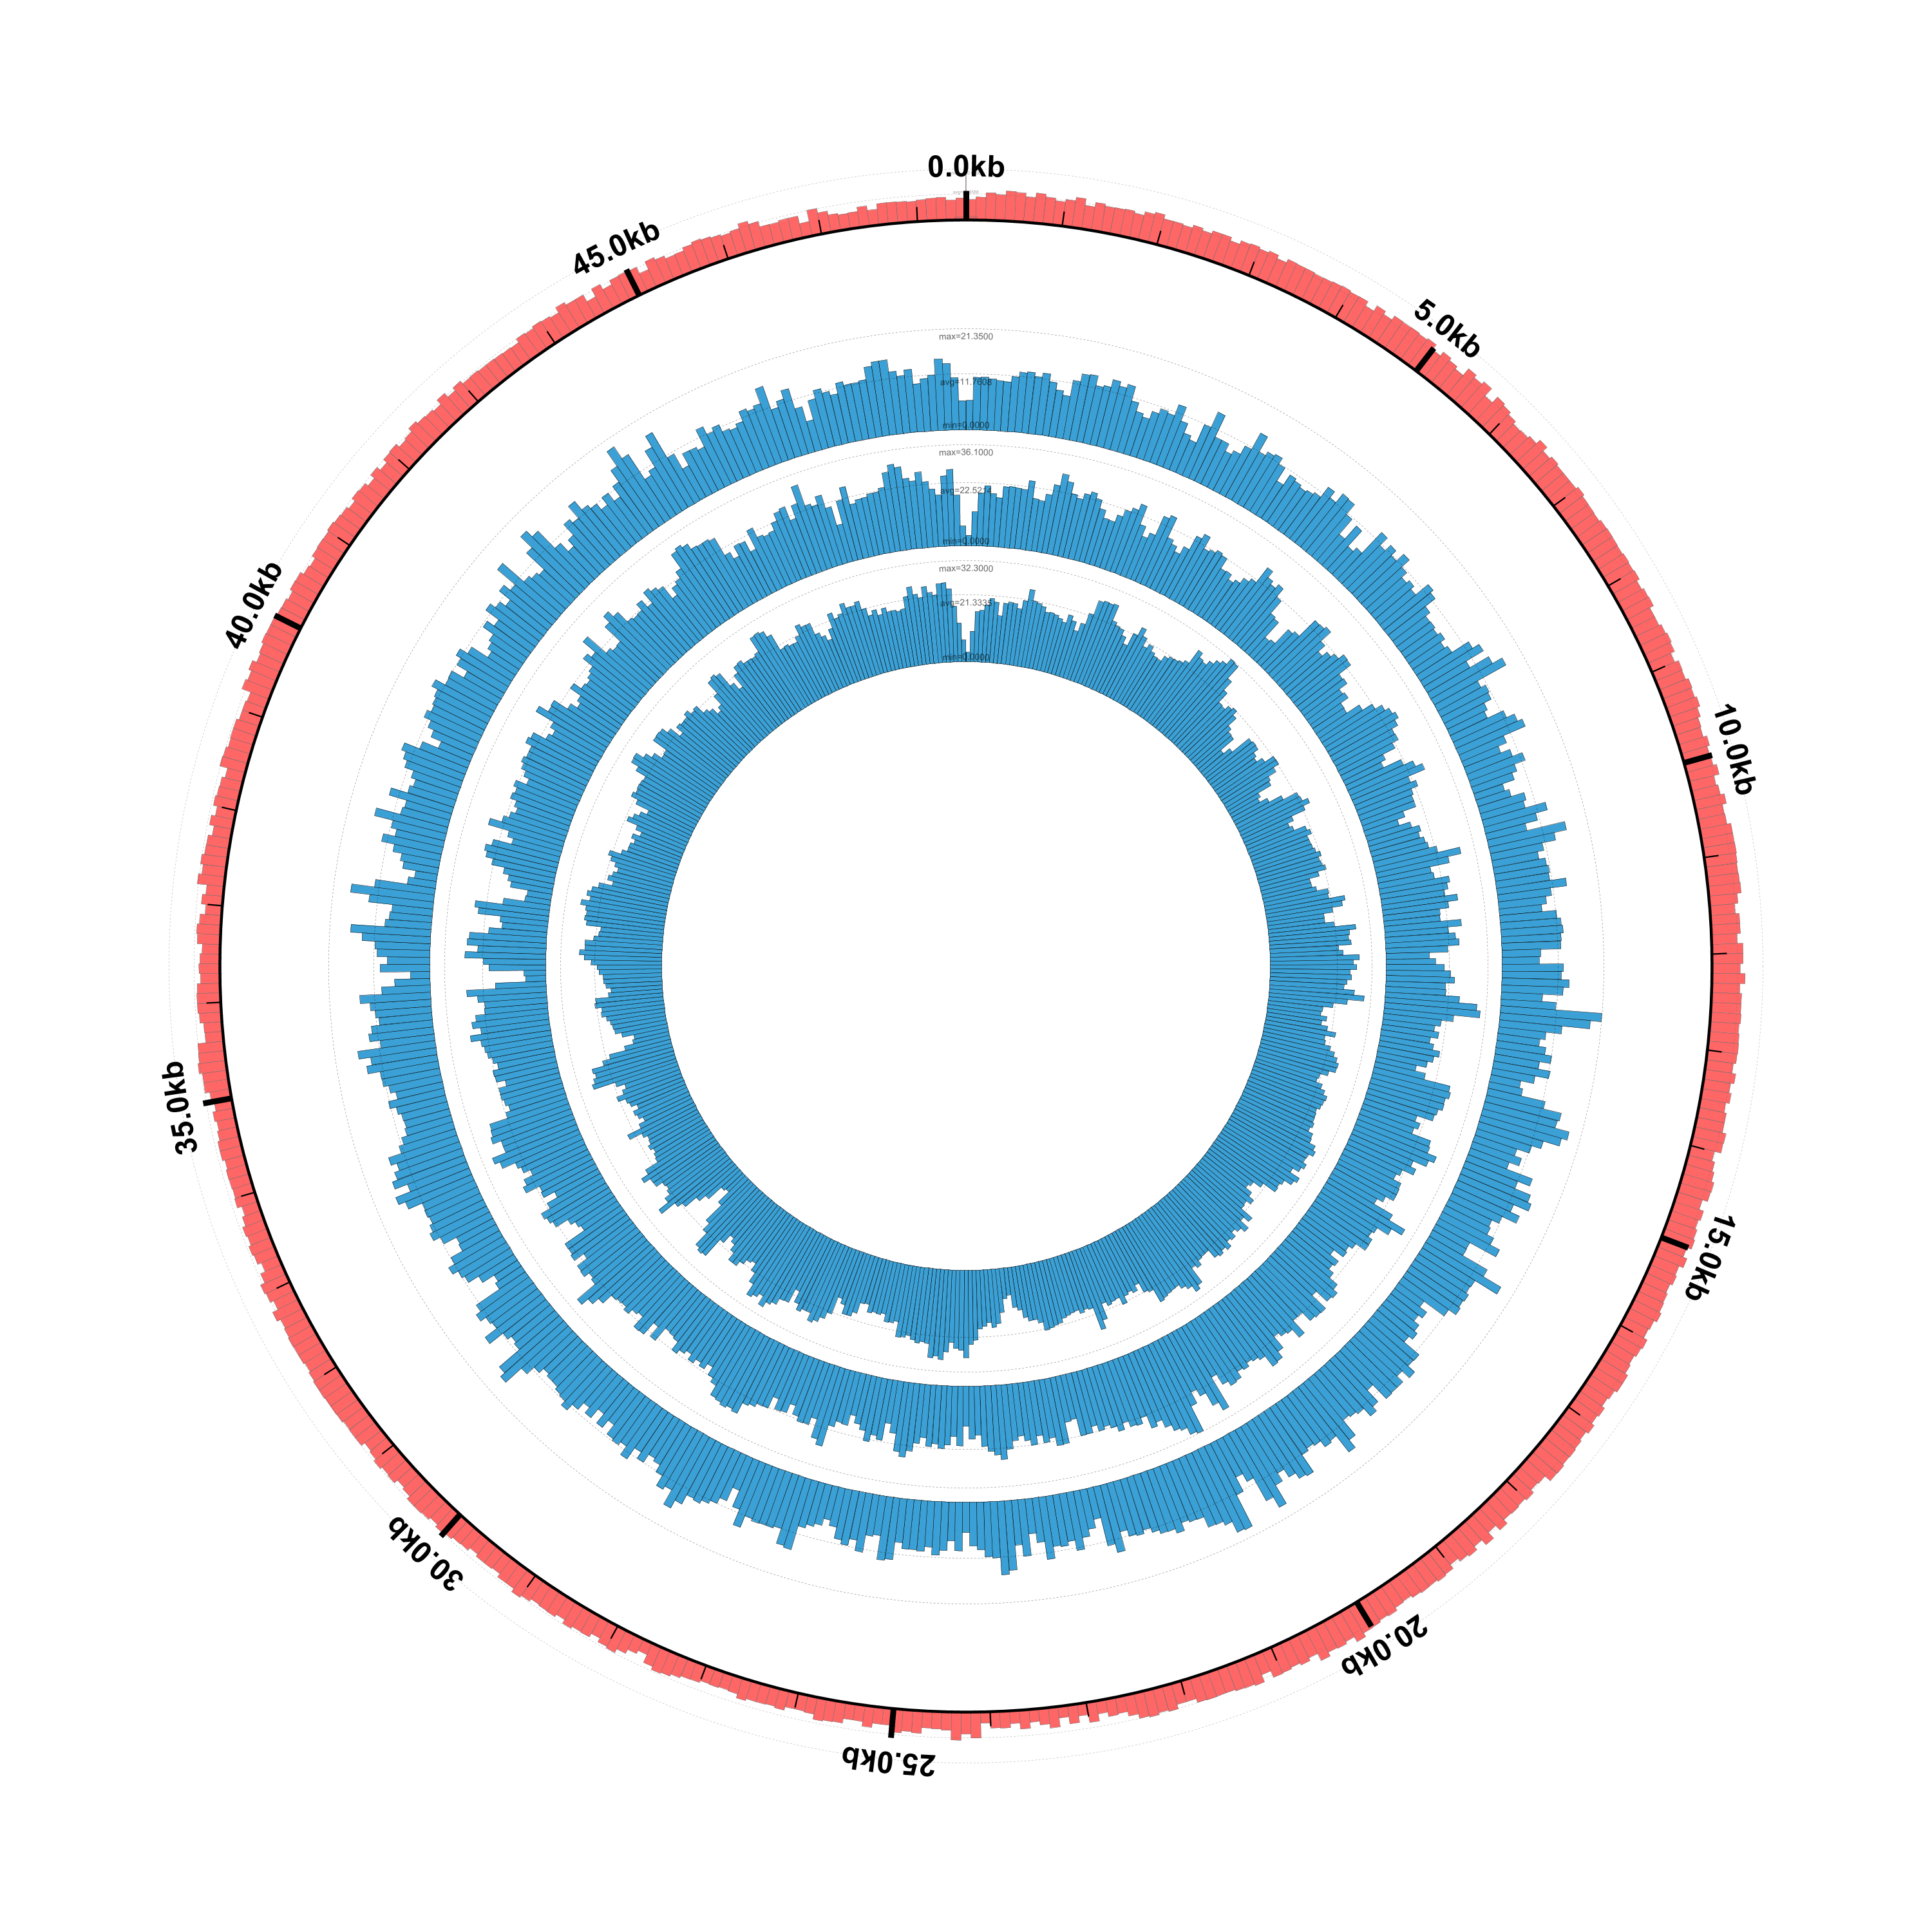
We’ve modified the configuration file to read the log-transformed coverage file and also to set the graph-max value to 1.85 for all three of the graphs:
$ circleator --contig_list=contig-list-ex1-gb.txt --config=coverage-ex2-lt.txt > coverage-ex2-lt.svg
$ rasterize-svg coverage-ex2-lt.svg png 3000 3000
Here’s the result. It’s not a particularly helpful visualization given the limited range of coverage in the data, but it’s a useful tool to have available:
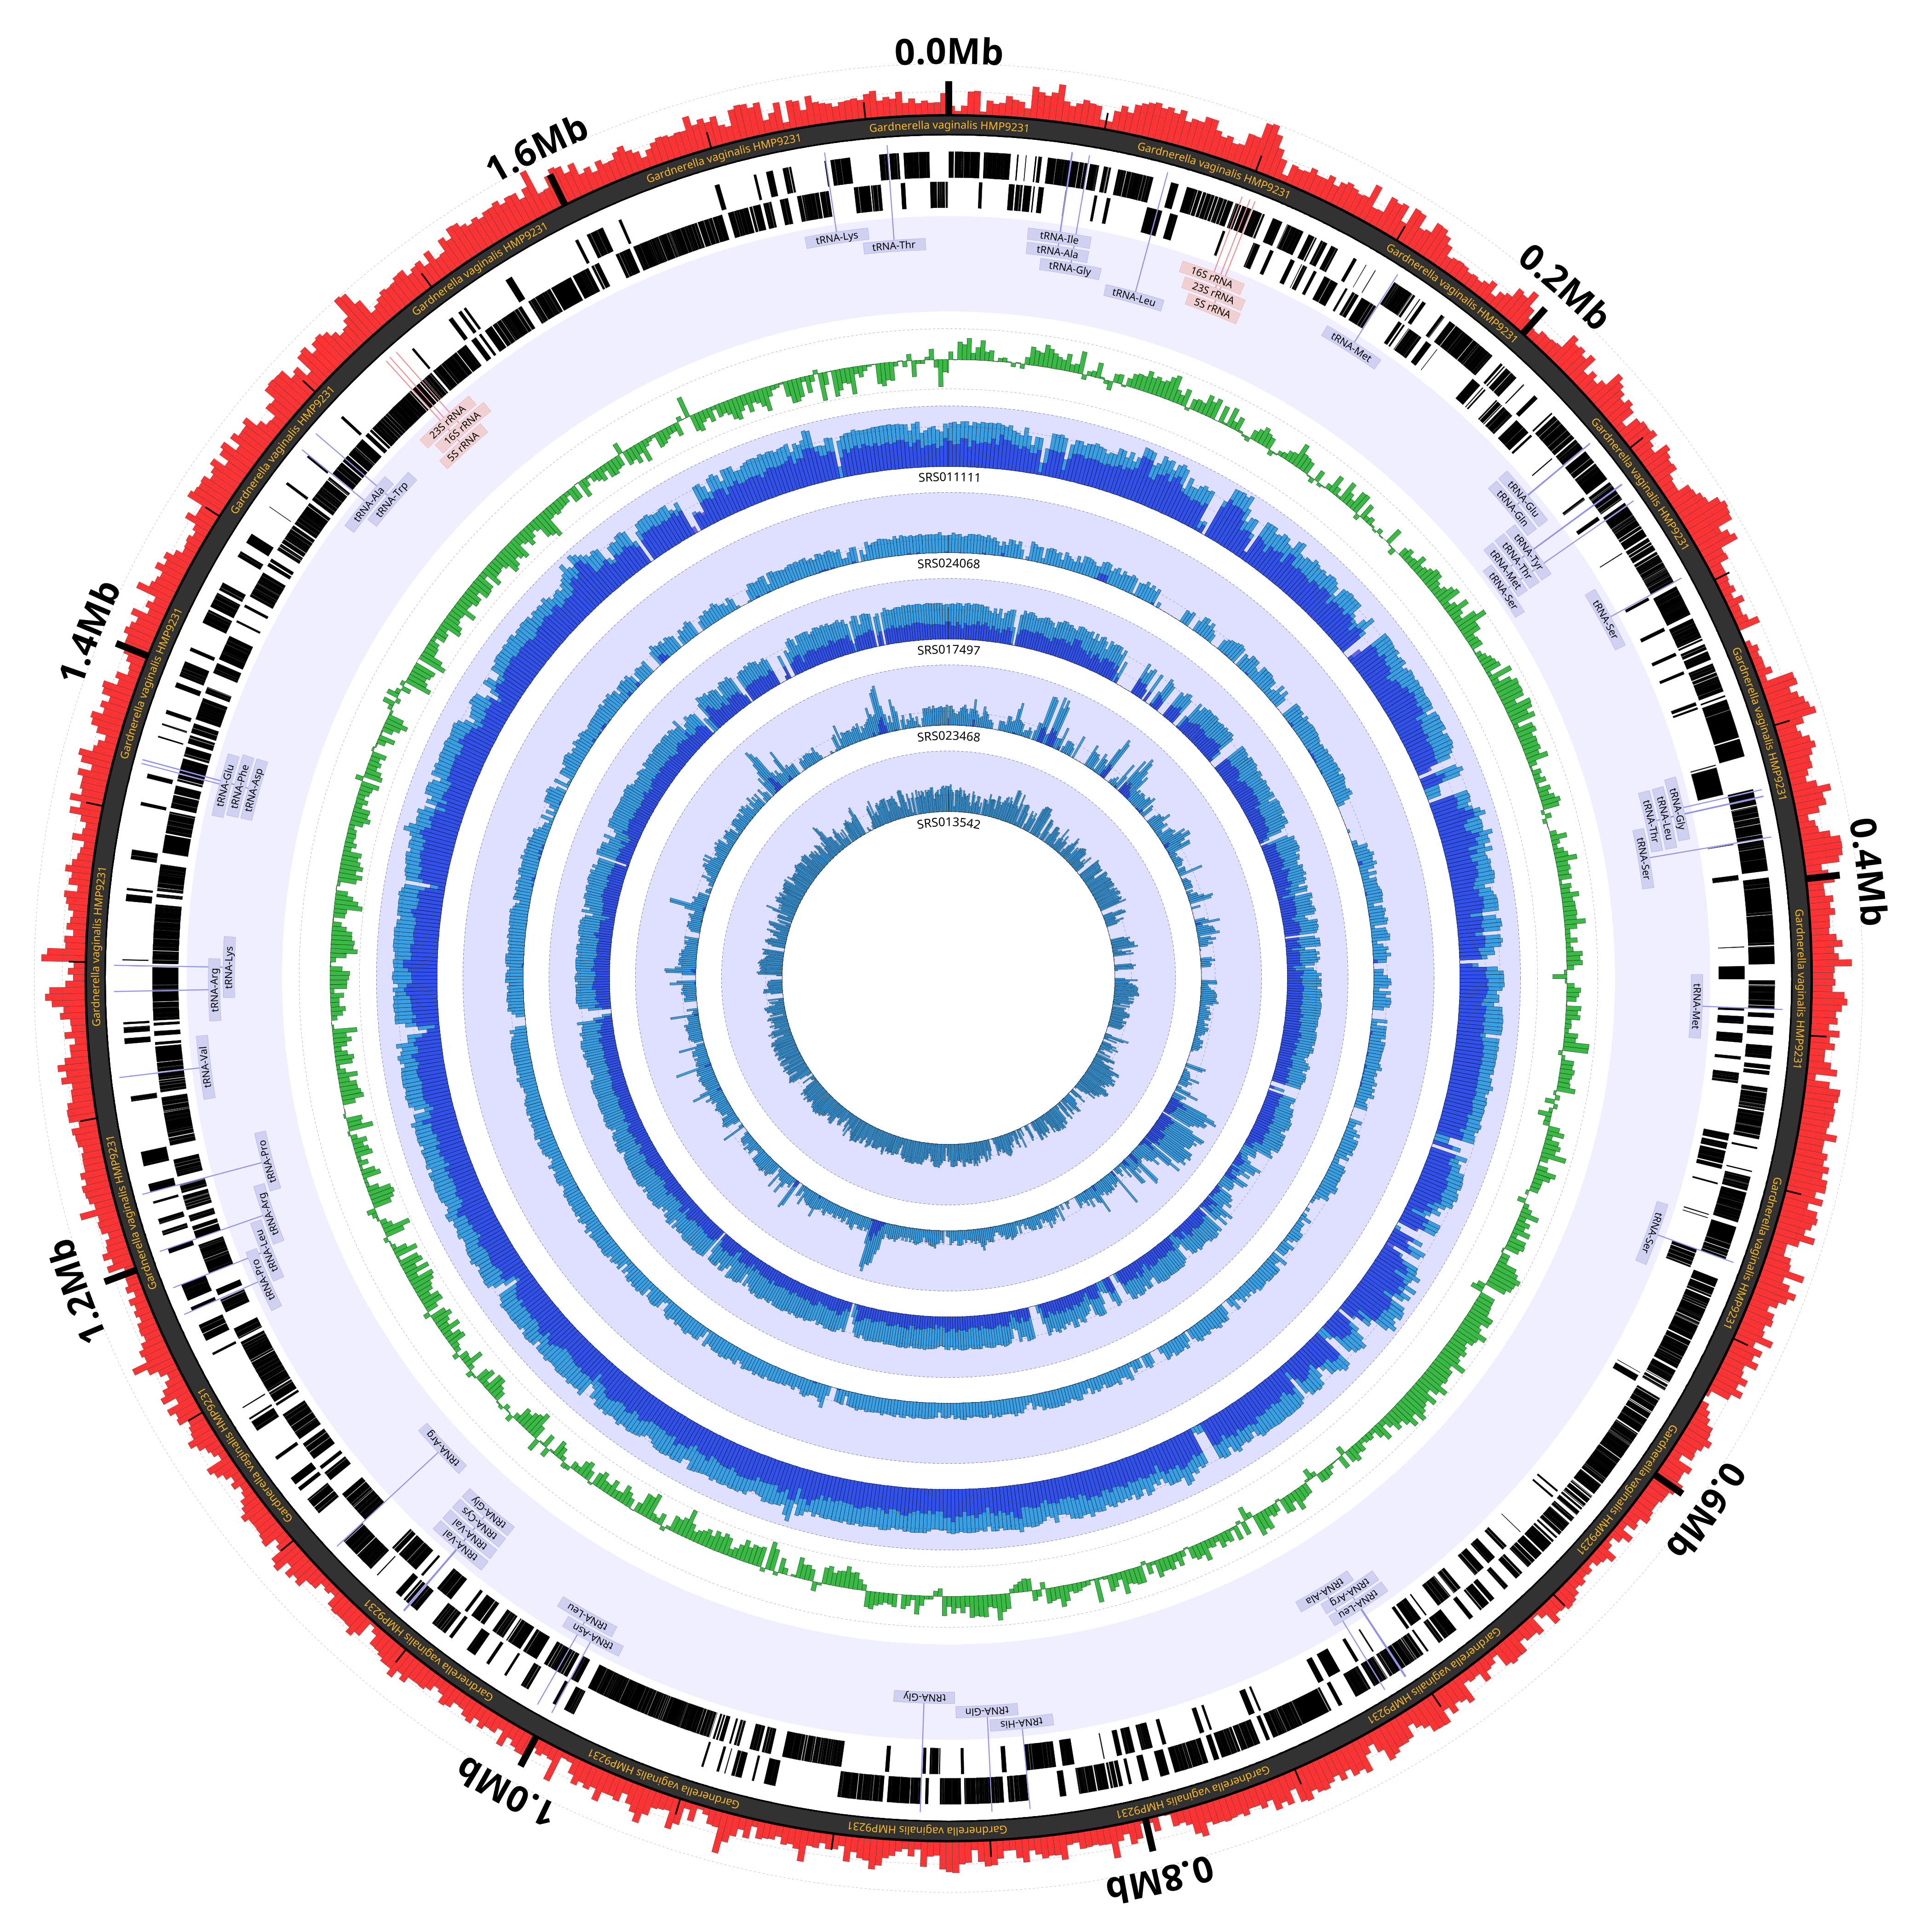
Example 3: Figure 1A from the 2014 Circleator Applications Note
The last example appears as Figure 1A in the Circleator Applications Note, and also as Figure 3 in the Supplemental Material:
Crabtree, J., Agrawal, S., Mahurkar, A., Myers, G.S., Rasko, D.A., White, O. (2014) Circleator: flexible circular visualization of genome-associated data with BioPerl and SVG. Bioinformatics, 10.1093/bioinformatics/btu505.
The data files and scripts used to generate this figure can be found in the Circleator GitHub repository:
The files in this directory include:
make-figures.sh- the script that runs Circleatorconf/Gv_HMP9231.cfg- the Circleator configuration filerun-bowtie.sh- the Bowtie commands used to generate the BAM filesmake-coverage-files.sh- runsbam_get_coverageon the BAM files (see Example 2 for details)
