Circleator
Overview
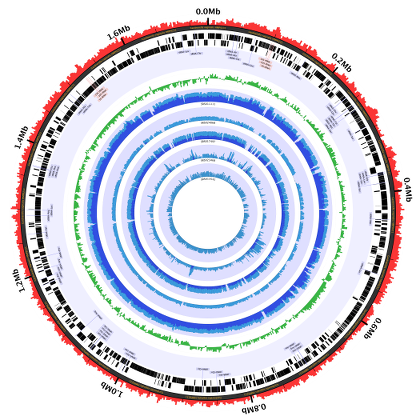
The Charm City Circleator–or Circleator for short–is a Perl-based visualization tool developed at the Institute for Genome Sciences in the University of Maryland’s School of Medicine. Circleator produces circular plots of genome-associated data, like this one:

Common uses of the tool include:
- Displaying the sequence and/or genes in a GenBank flat file.
- Highlighting differences and/or similarities in gene content between related organisms.
- Comparing SNPs and indels between closely-related strains or serovars.
- Comparing gene expression values across multiple samples or timepoints.
- Visualizing coverage plots of RNA-Seq read alignments.
Getting Started
As of release v1.0.2 Circleator is available as a Docker image on DockerHub:
https://cloud.docker.com/u/umigs/repository/docker/umigs/circleator
The image is somewhat large (~2GB) but includes the material from the tutorials/ section of this website, making it easier for new users to get up and running with the software. For example:
$ docker pull umigs/circleator:v1.0.2
v1.0.2: Pulling from umigs/circleator
.
.
.
7ba00a34ff5e: Pull complete
Digest: sha256:8a74aaa9478933502e3eb8852e0c043ee8f7ad714edc91aabd75526899ff251c
Status: Downloaded newer image for umigs/circleator:v1.0.2
$ docker run -dt --name 'c1' umigs/circleator:v1.0.2
6fbf6f645d20274e7916ac0a6e3dbe271a57888cc6bc241e4452ffcbcf301c61
jcrabtree@P180:~$ docker exec -i -t c1 /bin/bash
circleator@6fbf6f645d20:~$ whoami
circleator
circleator@6fbf6f645d20:~$ pwd
/home/circleator
circleator@6fbf6f645d20:~$ cd tutorials/coverage_plots
circleator@6fbf6f645d20:~/tutorials/coverage_plots$  circleator --data=lambda_virus.fa --config=coverage-ex1.txt > coverage-ex1.svg
INFO - started drawing figure using coverage-ex1.txt
INFO - reading from annot_file=./lambda_virus.fa, seq_file=, with seqlen=
INFO - gi|9626243|ref|NC_001416.1|: 0 feature(s) and 48502 bp of sequence
INFO - read 1 contig(s) from 1 input annotation and/or sequence file(s)
[mpileup] 1 samples in 1 input files
<mpileup> Set max per-file depth to 8000
INFO - parsed 48502/48502 line(s) from samtools mpileup eg1.sorted.bam |
[mpileup] 1 samples in 1 input files
<mpileup> Set max per-file depth to 8000
INFO - parsed 48502/48502 line(s) from samtools mpileup eg2.sorted.bam |
[mpileup] 1 samples in 1 input files
<mpileup> Set max per-file depth to 8000
INFO - parsed 48502/48502 line(s) from samtools mpileup eg3.sorted.bam |
INFO - finished drawing figure using coverage-ex1.txt
circleator@6fbf6f645d20:~/tutorials/coverage_plots$ rasterize-svg coverage-ex1.svg png 3000 3000
[warning] /usr/bin/rasterizer: JVM flavor 'sun' not understood
About to transcode 1 SVG file(s)

Converting coverage-ex1.svg to coverage-ex1.png ... ... success
To install Circleator from scratch, check out the Installation Guide. There’s also a detailed README on GitHub, Documentation on this website and a Google Group for Circleator questions and discussion.
Acknowledgments
This product includes color specifications and designs developed by Cynthia Brewer (http://colorbrewer.org).
Citation
An Applications Note describing Circleator has been published in Bioinformatics:
Crabtree, J., Agrawal, S., Mahurkar, A., Myers, G.S., Rasko, D.A., White, O. (2014) Circleator: flexible circular visualization of genome-associated data with BioPerl and SVG. Bioinformatics, 10.1093/bioinformatics/btu505.

